If you’ve ever stared at a tiny bump on your chromatogram and wondered whether it’s a real peak or just random noise, you’re definitely not alone. Almost every analyst runs into this moment, which is why understanding GC LOD LOQ becomes incredibly helpful. In this guide, we’ll walk through what LOD and LOQ actually mean, how the signal-to-noise method works, and how to turn noise values into a real concentration you can trust.
What Are LOD and LOQ? (GC LOD LOQ Basics)
When we talk about LOD (Limit of Detection), we mean the lowest concentration that rises above baseline noise enough for you to confidently say, “Yes, that’s a real signal.” Most labs treat 3× noise as the cutoff.
On the other hand, LOQ (Limit of Quantitation) is the lowest concentration you can quantify accurately. Traditionally:
- LOD ≈ 3 × noise
- LOQ ≈ 10 × noise
- or LOQ = 3.3 × LOD
Although these estimates are simple, they work extremely well for routine GC.
Seeing Signal-to-Noise in Action (GC LOD LOQ S/N View)
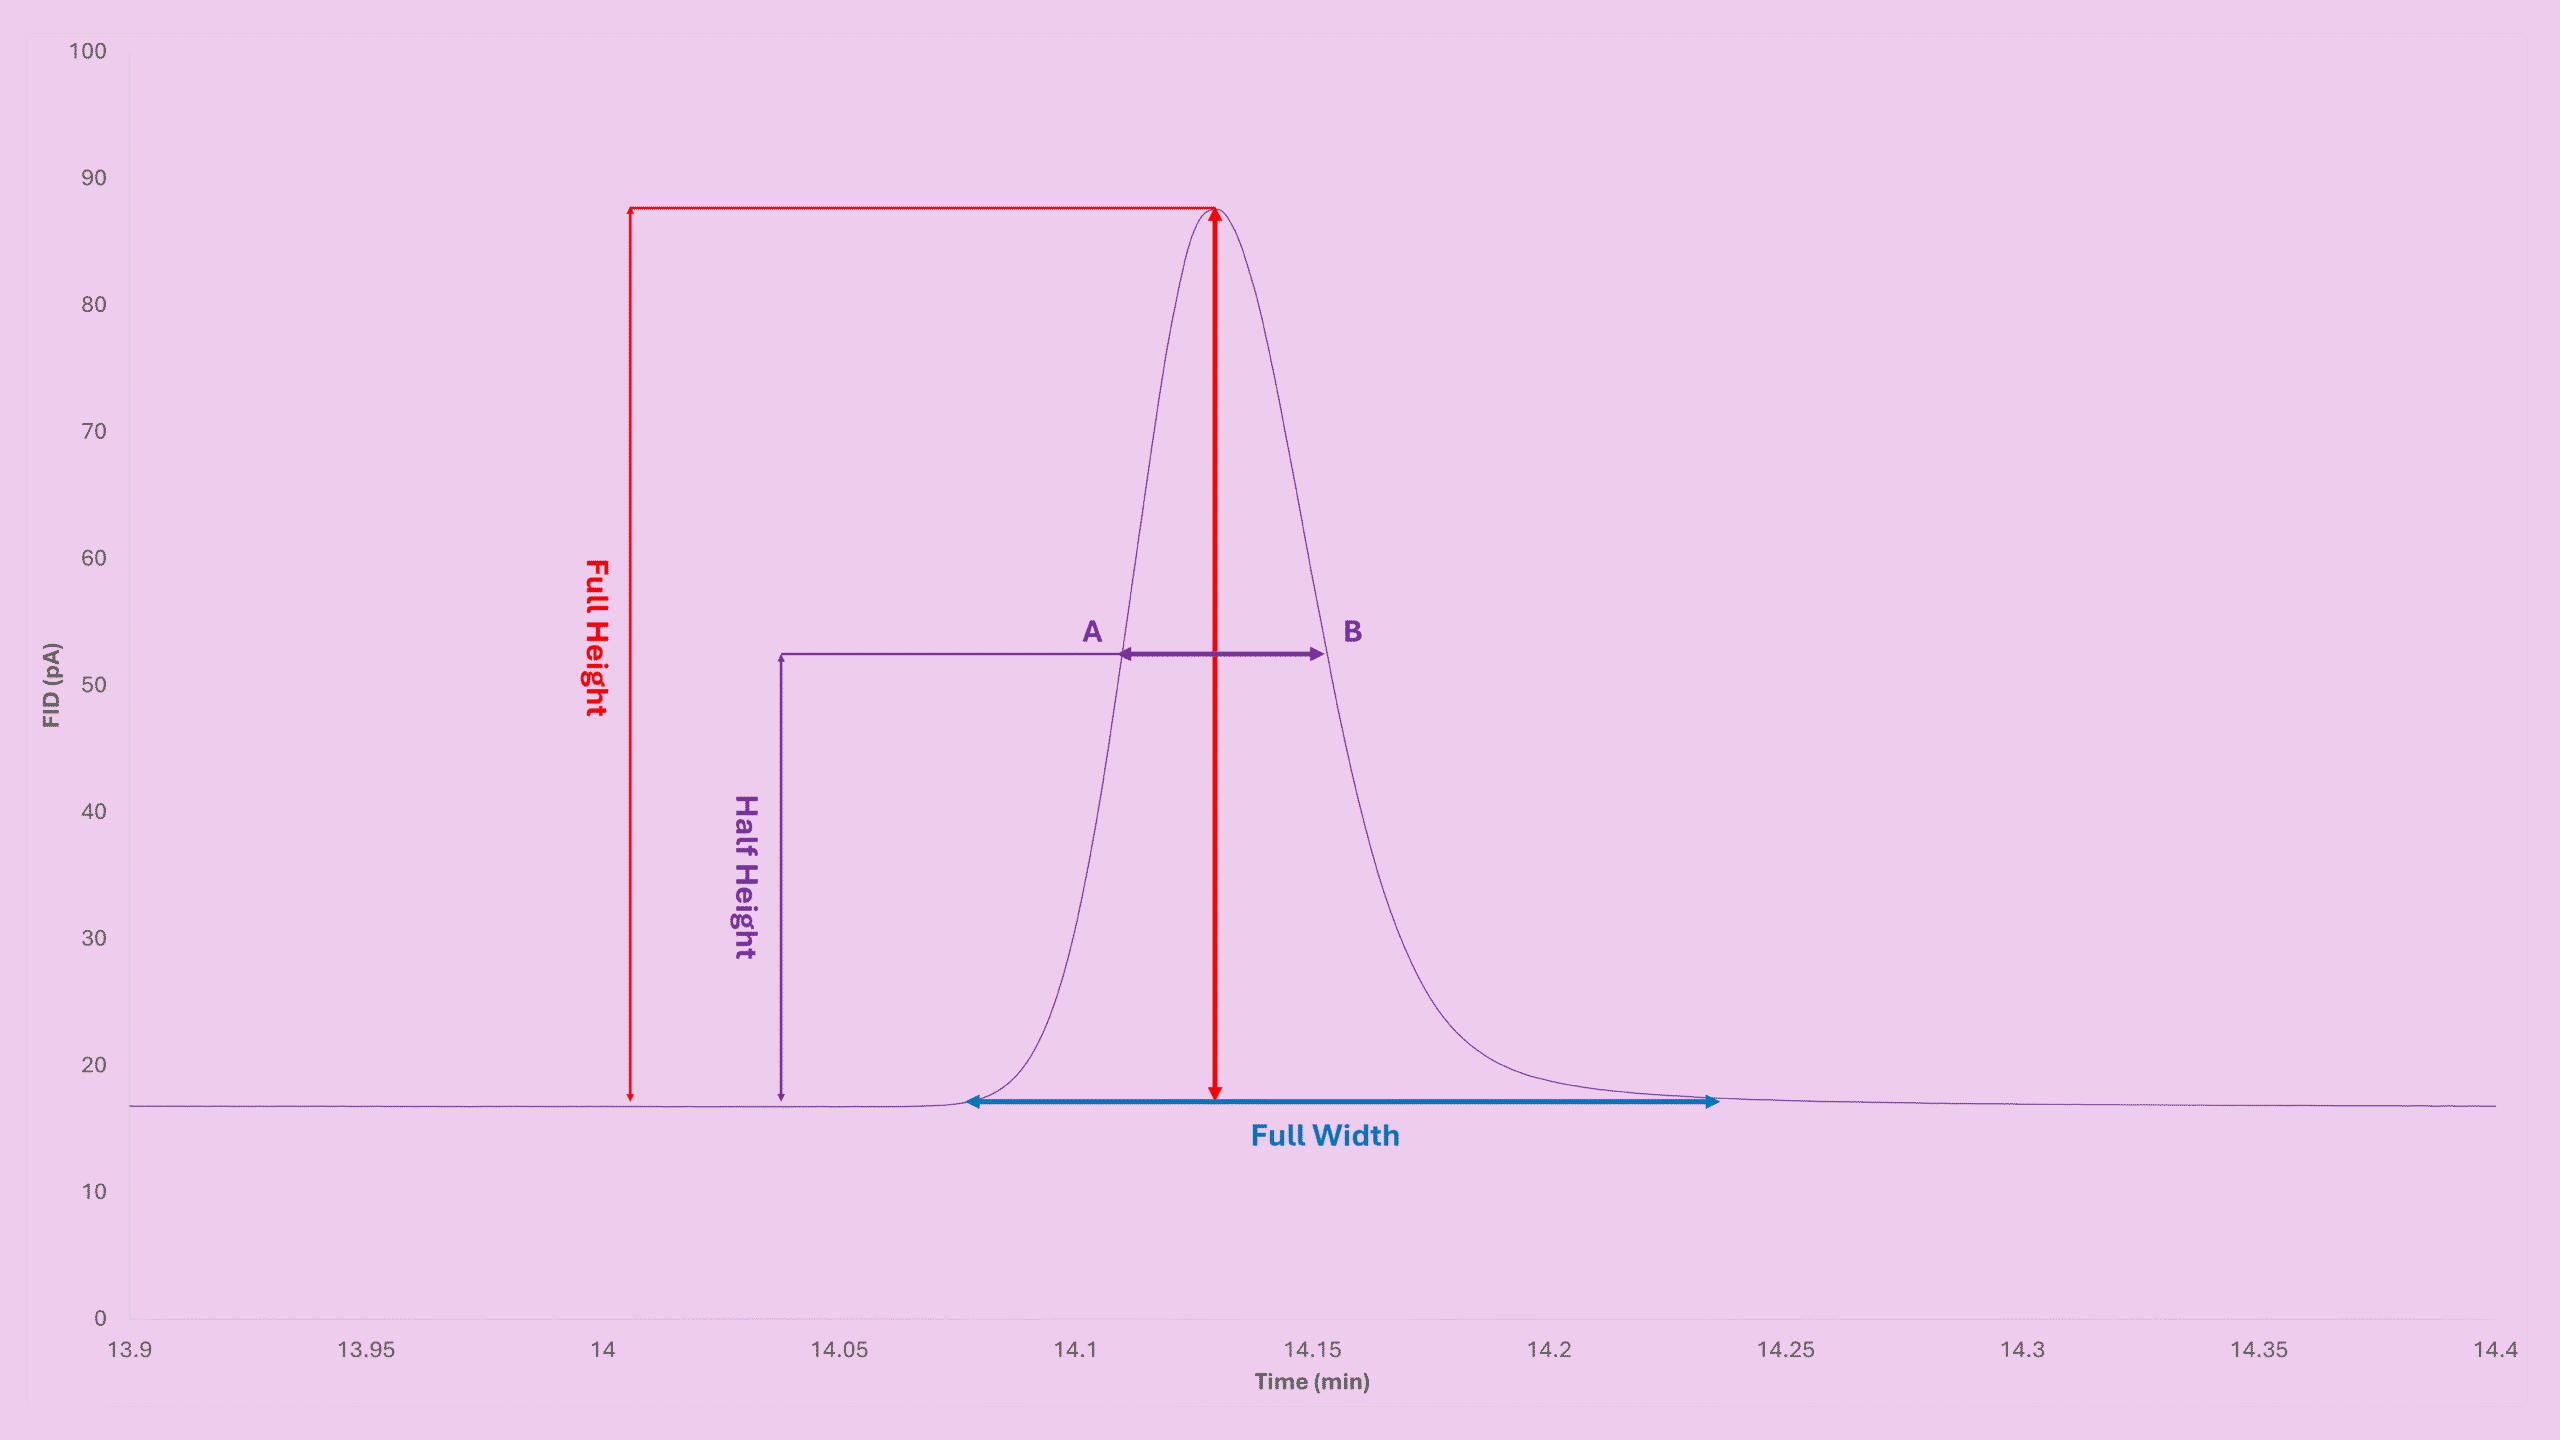
It’s easier to understand S/N visually. Imagine several peaks sitting on a noisy baseline, each one rising a little higher.

As the signal grows taller compared to the noise, your confidence improves dramatically. Because of that, most GC detectors (FID, TCD, ECD, SCD, MS) use 3× noise as the minimum level for detection.
How S/N Turns Into Concentration (GC LOD LOQ Formula)
Noise values are measured in detector units (pA, mV, counts). However, LOD must be expressed in concentration units such as ppm or µg/mL. Fortunately, converting noise into concentration is very straightforward once you have one known standard.
Here’s a classic example:
- Standard concentration: 10 ppm benzene
- Peak height: 5 pA
- Noise: 0.03 pA
- Detection threshold: 3× noise
1. Set the relationship
10 ppm  →  5 pA
LOD     →  3 × noise
2. Plug into the formula
General formula:
LOD = (Factor × Noise × Concentration) / Peak Height
Apply the numbers:
LOD = (3 × 0.03 pA × 10 ppm) / 5 pA
LOD = 0.18 ppm
So any benzene peak above 0.18 ppm is considered detectable. Anything lower is unreliable and usually treated as “not detected.”
Where to Find Noise & Peak Height (GC LOD LOQ in Software)
Your GC data system (Agilent, Shimadzu, Waters, Thermo, etc.) gives you exactly what you need.

Next, zoom into a quiet part of the baseline to measure noise.

Once you have peak height and noise, calculating LOD becomes quick and consistent.
Important Practical Tips (GC LOD LOQ Best Practices)
1. Keep Your Peak Symmetric
LOD calculations assume height scales proportionally with concentration. Tailing or distorted peaks break this assumption.
2. Use a Standard Near the True LOD
A simple guideline I often use:
- Standard / LOD < 10 → excellent
- 10–20 → acceptable
- >20 → risky
When possible, dilute your standard to bracket the expected LOD.
3. Units Follow the Standard
Detector units cancel out, so LOD always inherits the same units as your standard (ppm, mg/m³, µg/mL).
Understanding LOQ in the GC LOD LOQ Context
Because LOD is already known, LOQ is extremely easy to calculate:
LOQ = 3.3 × LOD
Using our example:
LOQ = 3.3 × 0.18 ppm
LOQ = 0.594 ppm
This is where your peak becomes reliably quantitative, not just detectable.
Key Takeaways
- LOD = lowest concentration that rises above noise.
- LOQ = lowest concentration that is accurately quantifiable.
- The GC LOD LOQ formula you can always trust is:
LOD = (Factor × Noise × Concentration) / Peak Height - Always evaluate peak symmetry, noise region, and standard proximity to your estimated LOD.
Try the Instant Calculator
A GC LOD LOQ calculator that implements all formulas discussed in this blog post can be found at GC LOD Calculator – Signal to Noise Ratio & Peak Height. Just enter:
- Noise
- Standard concentration
- Peak height
- S/N factor
The result updates automatically, perfect for method development, detector comparison, and troubleshooting.
Before You Leave
If this breakdown of GC LOD LOQ made your workflow clearer, feel free to explore the rest of my series about Detection Limit (LOD/LOQ) or other GC calculators in the Free GC Calculators section.
I’m adding more guides, examples, and interactive tools regularly to make GC method development easier for everyone. Sharing these tools with colleagues helps the whole GC community troubleshoot with confidence.