If you read the previous post on the 3×SD approach for estimating LOD, you might have wondered what to do when your blanks contain no peaks at all. That’s exactly the kind of scenario the GC LOD zero blank method is designed for. In this guide, we’ll break down how to calculate LOD when your blank runs show absolutely nothing — no peaks, no areas, zero values. And yes, it’s still doable and surprisingly simple once you understand the logic behind it.
Why the GC LOD Zero Blank Method Is Needed
In the last article, we used the formula:
LOD = MeanBlank + 3 × SDBlank
But with a GC LOD zero blank situation, every blank generates an area of 0, so:
- MeanBlank = 0
- SDBlank = cannot be computed (all values are identical)
This leads to a very valid question:
“How do I calculate LOD when my blanks literally have nothing?”
The good news? When blanks have zero response, the equation simplifies beautifully:
LOD = 3 × SDBlank
But since we can’t compute SDBlank, we replace it with SD from a low-level standard.
The Role of a Low-Level Standard in GC LOD Zero Blank Calculations
When blank peaks don’t exist, we switch to a low concentration standard. The standard must be:
- Close to the expected LOD
- Preferably less than 10× the anticipated LOD
- Acceptable up to 20×, but anything beyond that should be treated cautiously
Why?
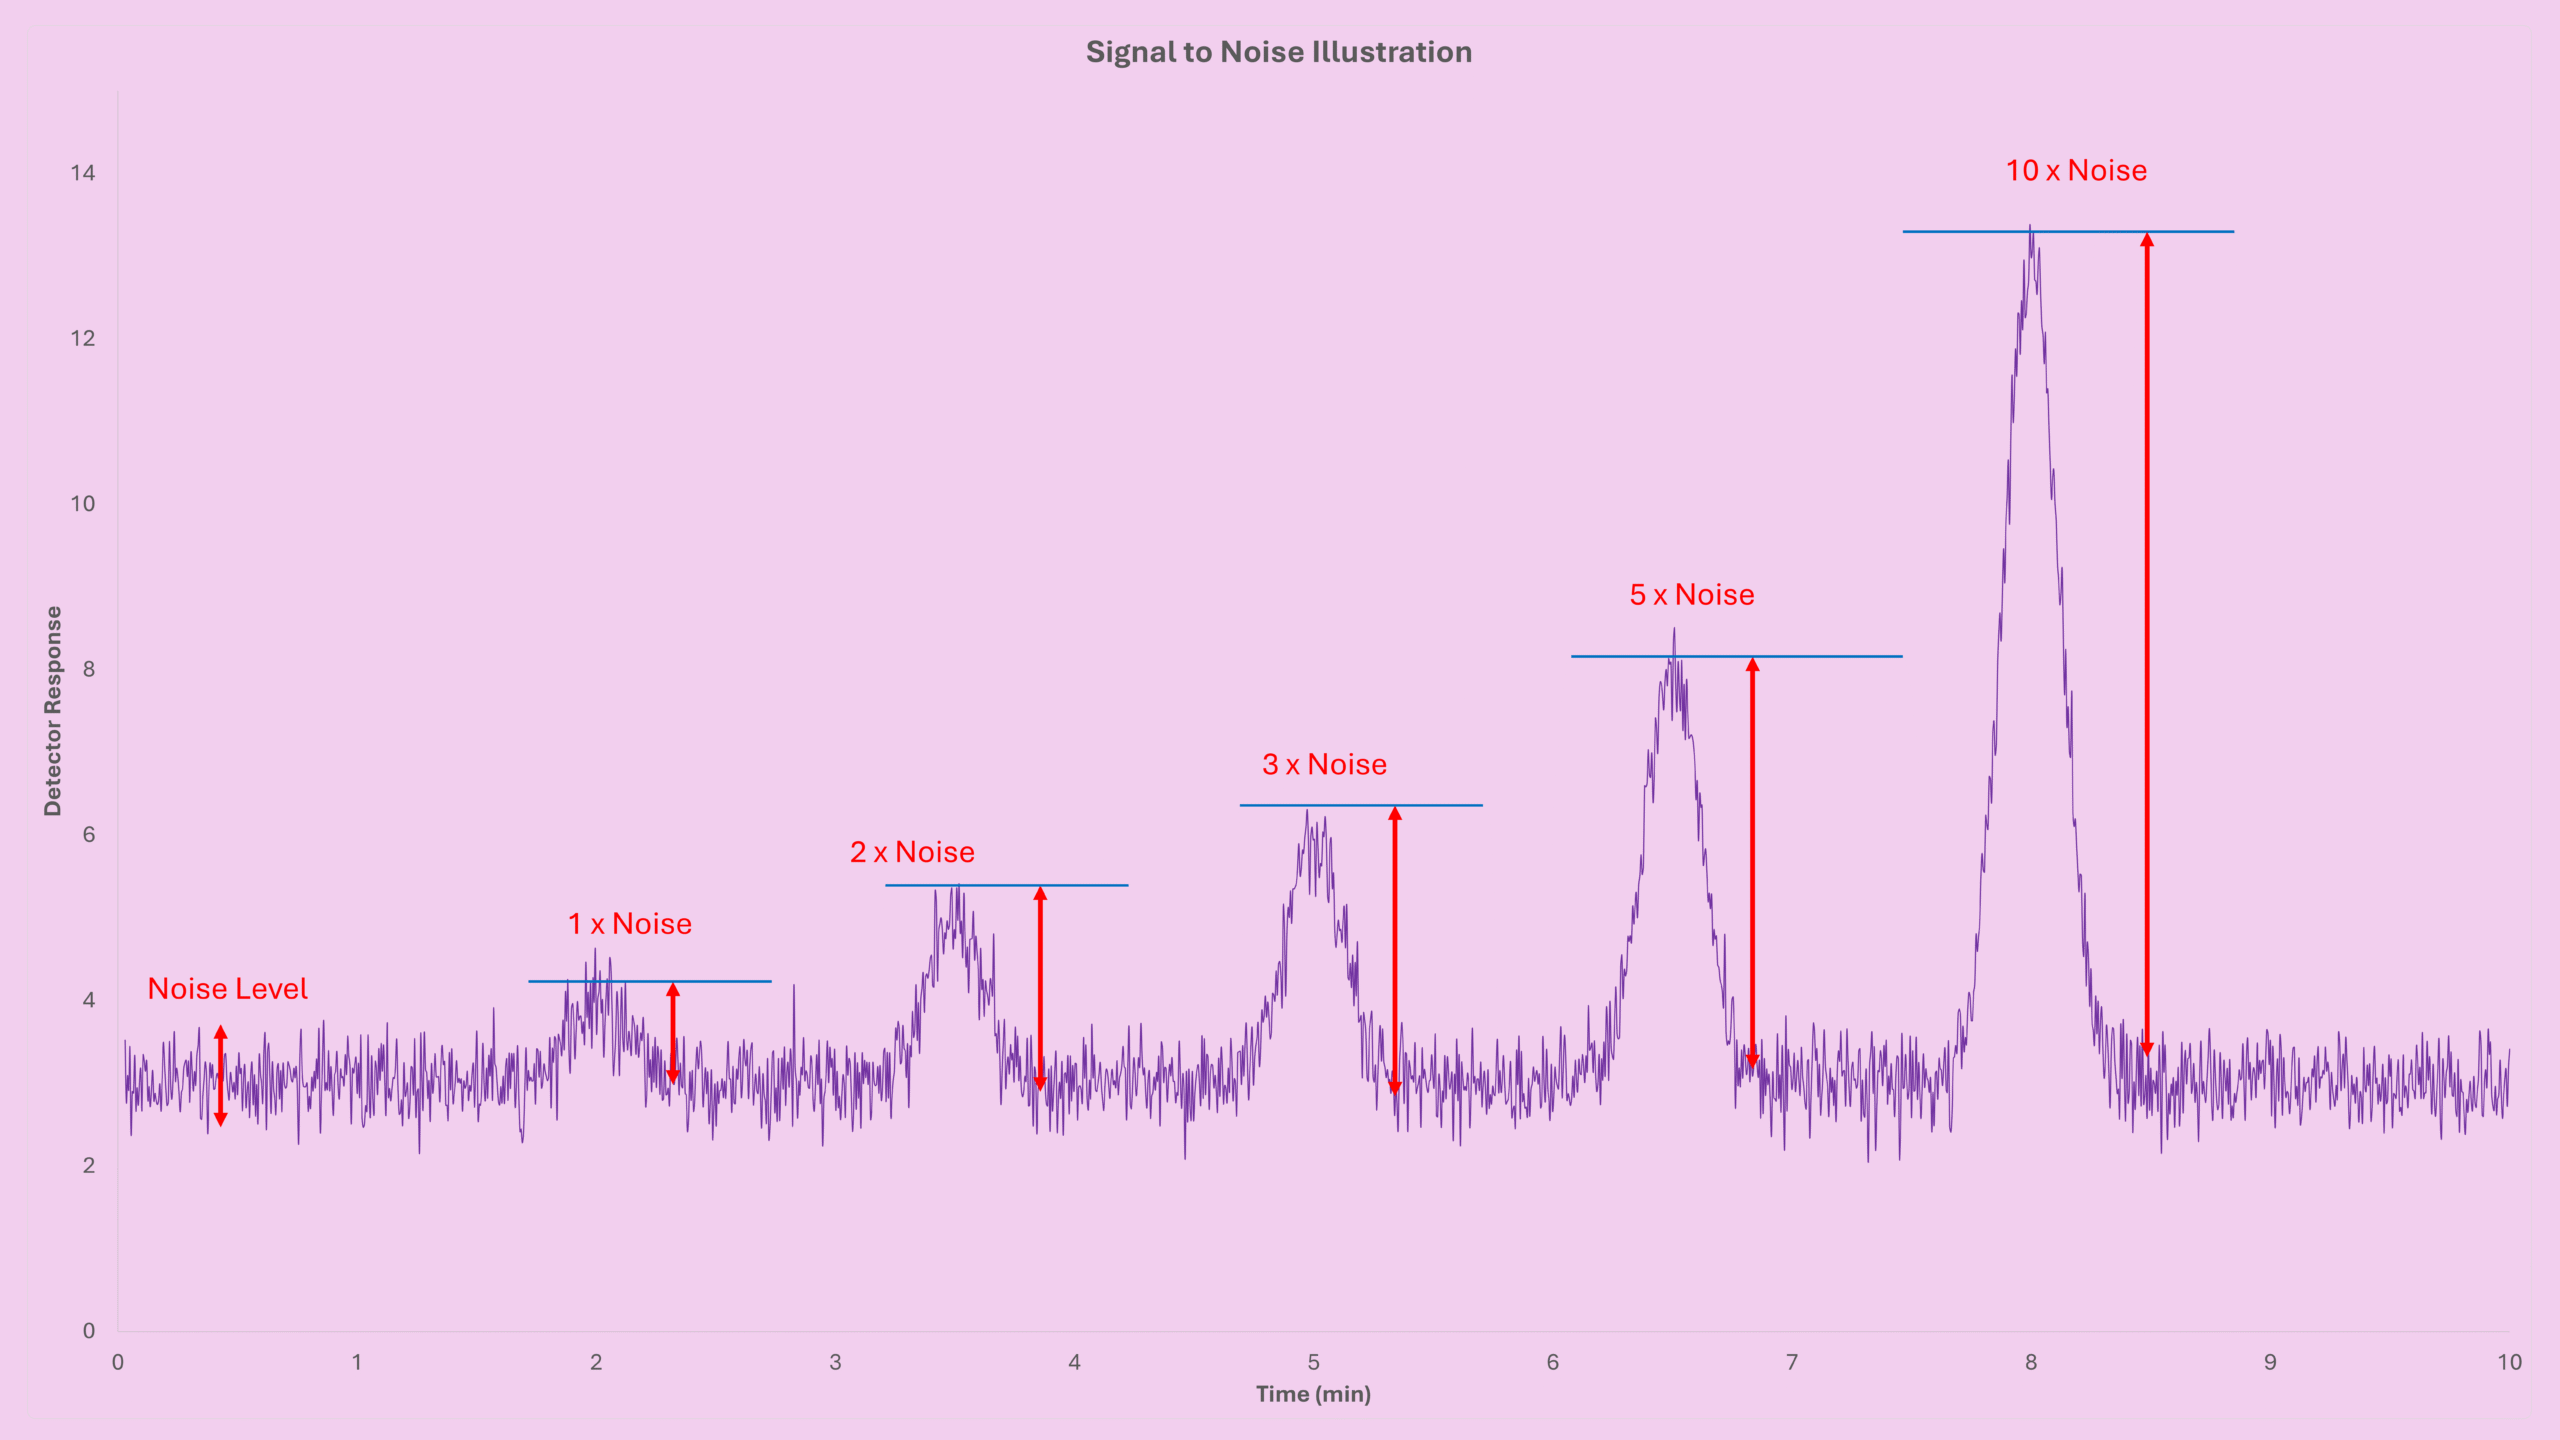
Because only when the signal is close to the detection limit will its variability (SD) resemble the variability of noise.
This gives us the simplified LOD expression:
LOD = 3 × SDStandard
But since SDStandard is in area units, we need to convert it back to concentration units.
Collecting Data for the GC LOD Zero Blank Method
Let’s say you inject a low-level standard at least 8 times. Eight runs are my recommended minimum because fewer injections give unstable standard deviation estimation.
Your chromatograms may look something like this:

From these 8 injections, extract the peak areas and compute in Excel:
Average = AVERAGE(A1:A8)
SD       = STDEV.P(A1:A8)
(Use STDEV.P, not STDEV.S — because noise/variability is treated as a population.)
Deriving the Final GC LOD Zero Blank Formula
Assume your standard concentration is 10 ppm and produces an average area of AvgArea, and the standard deviation from the 8 runs is SDStandard.
We set up a proportion:
10 ppm  → AvgArea
LOD     → 3 × SDStandard
Rearranging gives:
LOD = (3 × SDStandard × ConcentrationStandard) / AverageAreaStandard
This expresses LOD in concentration units, which is what we want.
And LOQ follows the usual rule:
LOQ = 3.3 × LOD
Simple, clean, and fully aligned with analytical best practices.
Key Takeaways
- When blanks have no peaks, use the GC LOD zero blank method.
- The blank mean becomes zero, but SD must come from a low-concentration standard.
- Always use at least 8 injections for stable SD estimation.
- The required formula is:
LOD = (3 × SDStandard × ConcentrationStandard) / AverageAreaStandard - LOQ remains 3.3 × LOD.
- Keep the standard’s concentration reasonably close to the expected LOD.
Try the Instant Calculator
A calculator that implements the approach discussed in this blog post can be found at GC LOD Calculator – Standard Deviation of a Known Standard. Just enter:
- Areas of a peak from standard runs
- Concentration of the peak
The result updates automatically — perfect for method development, detector comparison, and troubleshooting.
Before You Go
If this walkthrough helped you understand how to handle the scenario of no peaks from blank runs, feel free to explore the other LOD calculators in the Free GC Calculator section. Each method has its place — and mastering them gives you a reliable toolbox for any GC method development challenge.
To read the earlier posts in this GC LOD series: