If you’ve ever wondered which detection limit approach you should use in your GC work, this LOD calculation guide will finally clear up the confusion. After writing five detailed posts covering every major LOD method, I wanted to wrap everything together in one practical, friendly guide that helps you choose the right method instantly — and revisit the exact calculator you need whenever the situation demands it.
This guide acts as your master map for understanding GC LOD, comparing approaches, and jumping straight to each full tutorial.
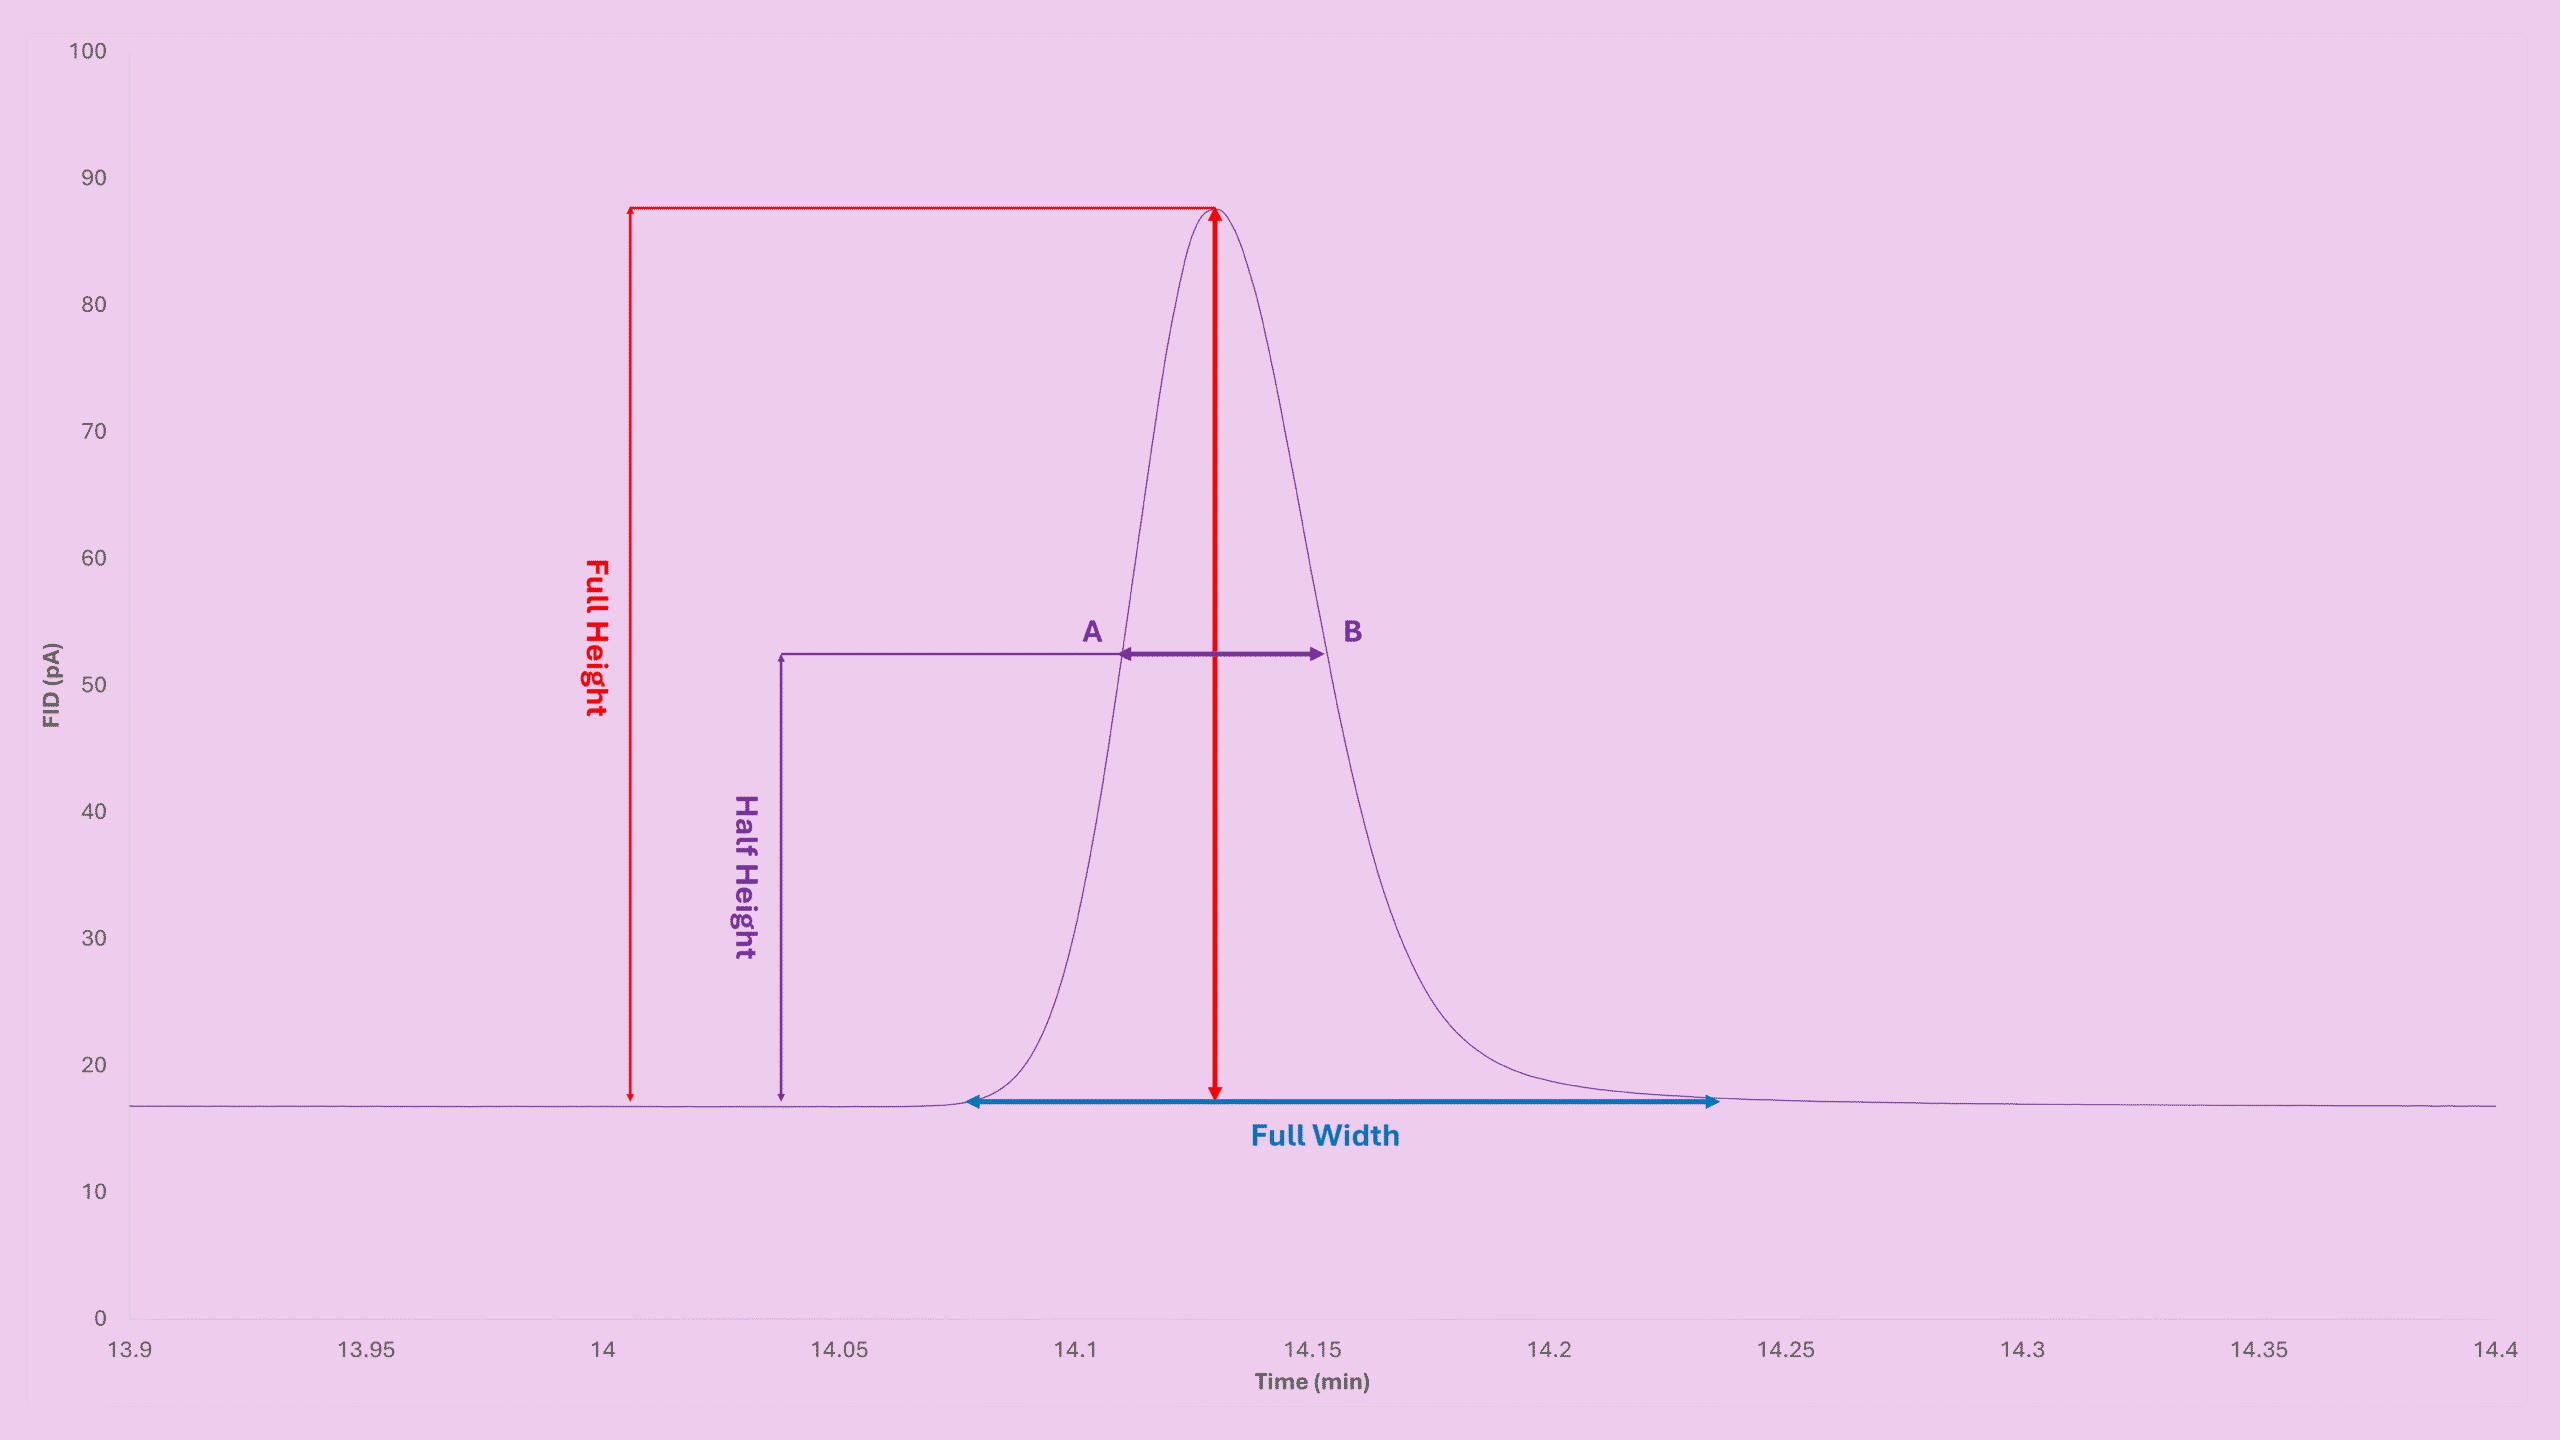
1. LOD Calculation Guide: Signal-to-Noise Approaches
When to Use This Approach
Use the S/N approach when:
- you need a quick estimate,
- you only have one known standard,
- you want a fast and intuitive method,
- you are doing vendor-style acceptance checks or troubleshooting.

Formula (Peak Height–Based)
LOD = (Factor × Noise × Concentration) / Peak Height
Formula (Peak Area + Peak Width)
LOD = (Factor × Noise × Concentration × Width_1/2 × 60) / Area
LOQ Relationship
LOQ = 3.3 × LOD
What You Need to Prepare
- One calibration standard
- Noise before/after the peak
- Peak height or peak area + width
- One clean, repeatable chromatogram
Inputs Needed for the Calculator
- S/N factor (commonly 3)
- Noise
- Standard concentration
- Peak height or peak area and width
Original Posts
Height-based method:
GC LOD LOQ by Signal to Noise: A Friendly Guide for GC Users
Peak area & width method:
GC LOD Formula: A Simple Way to Estimate Detection Limits Using Peak Area
Calculator Links
Height-based method:
GC LOD SN Calculator – Signal to Noise Ratio & Peak Height
Peak area & width method:
GC LOD Area Calculator – Signal to Noise Ratio & Peak Area – Peak Width
2. LOD Calculation Guide: Blank Standard Deviation Methods
When to Use This Approach
Choose this approach when:
- you want higher reliability than S/N,
- you don’t have enough calibration levels for residual SD,
- you can run multiple blanks or multiple low-level standards.

Formula (Blanks Contain a Small Peak)
LOD = Mean_Blank + 3 × SD_Blank
Formula (Blanks Show No Peak — Zero Blank Method)
LOD = (3 × SD_Standard × Concentration_Standard) / AverageArea_Standard
LOQ Relationship
LOQ = 3.3 × LOD
What You Need to Prepare
- One low standard
- At least 8 repetitive runs
- Peak areas from each run
Inputs Required
- 8 peak areas
- Calibration slope/intercept for blank-run method
- Standard concentration for zero-blank method
Original Posts
Blank-run SD method:
GC LOD Standard Deviation: A Clear Guide to the 3×SD Detection Limit Method
Zero-blank method:
GC LOD Zero Blank: How to Calculate LOD When Blank Runs Have No Peaks
Calculator Links
Blank-run SD method:
GC LOD Blank SD Calculator – Standard Deviation From Blanks
Zero-blank method:
GC LOD Standard SD Calculator – Standard Deviation From Known Standard
3. LOD Calculation Guide: Calibration Residual Standard Deviation
When to Use This Approach
This method is ideal when:
- you want the most rigorous, most defensible estimate,
- you need results for scientific publications,
- you want to account for all variations: sample prep, injection, hardware, software, linearity… everything.

Residual Standard Deviation Formula
Residual_SD = sqrt( Σ(RealArea_i − CalculatedArea_i)² / (n − 2) )
LOD Formula
LOD = (3.3 × Residual_SD) / Slope
LOQ Formula
LOQ = 3 × LOD
What You Need to Prepare
- At least 4 calibration points
- Concentration + peak area for each
- The calibration slope
Inputs Required
- Known concentrations
- Peak areas
- Calculator handles slope + residual SD
Original Post
GC LOD Residual SD: Simple Detection Limit Guide
Calculator Link
GC LOD RSD Calculator – Residual Standard Deviation
Key Takeaways
- Signal-to-noise → fastest method, good for screening or vendor-style checks.
- Blank SD → reliable when few calibration points are available.
- Zero-blank method → best when blanks do not show a peak.
- Residual SD → the most scientifically accepted method, ideal for publications.
- Every method has a matching calculator already built for you.
- Always ensure good peak symmetry, consistent injection, and suitable standard levels.
Your Next Step
Save this LOD calculation guide and revisit it any time you need to estimate LOD or LOQ. Every formula and calculator is just one click away, making this your go-to reference for GC detection limits.