In this post, we focus on FID RRF Normalization, a practical way to quantify individual compounds in a GC sample without calibrating each one. If you’ve ever wondered how methods like ASTM D6729 or ASTM D6730 report concentrations even when no individual calibration is performed, the answer lies in relative response factor (RRF) and total normalization.
Once you understand the normalization concept laid out in this blog post, those calculation algorithms stop looking mysterious. Instead, they become logical, structured, and surprisingly elegant.
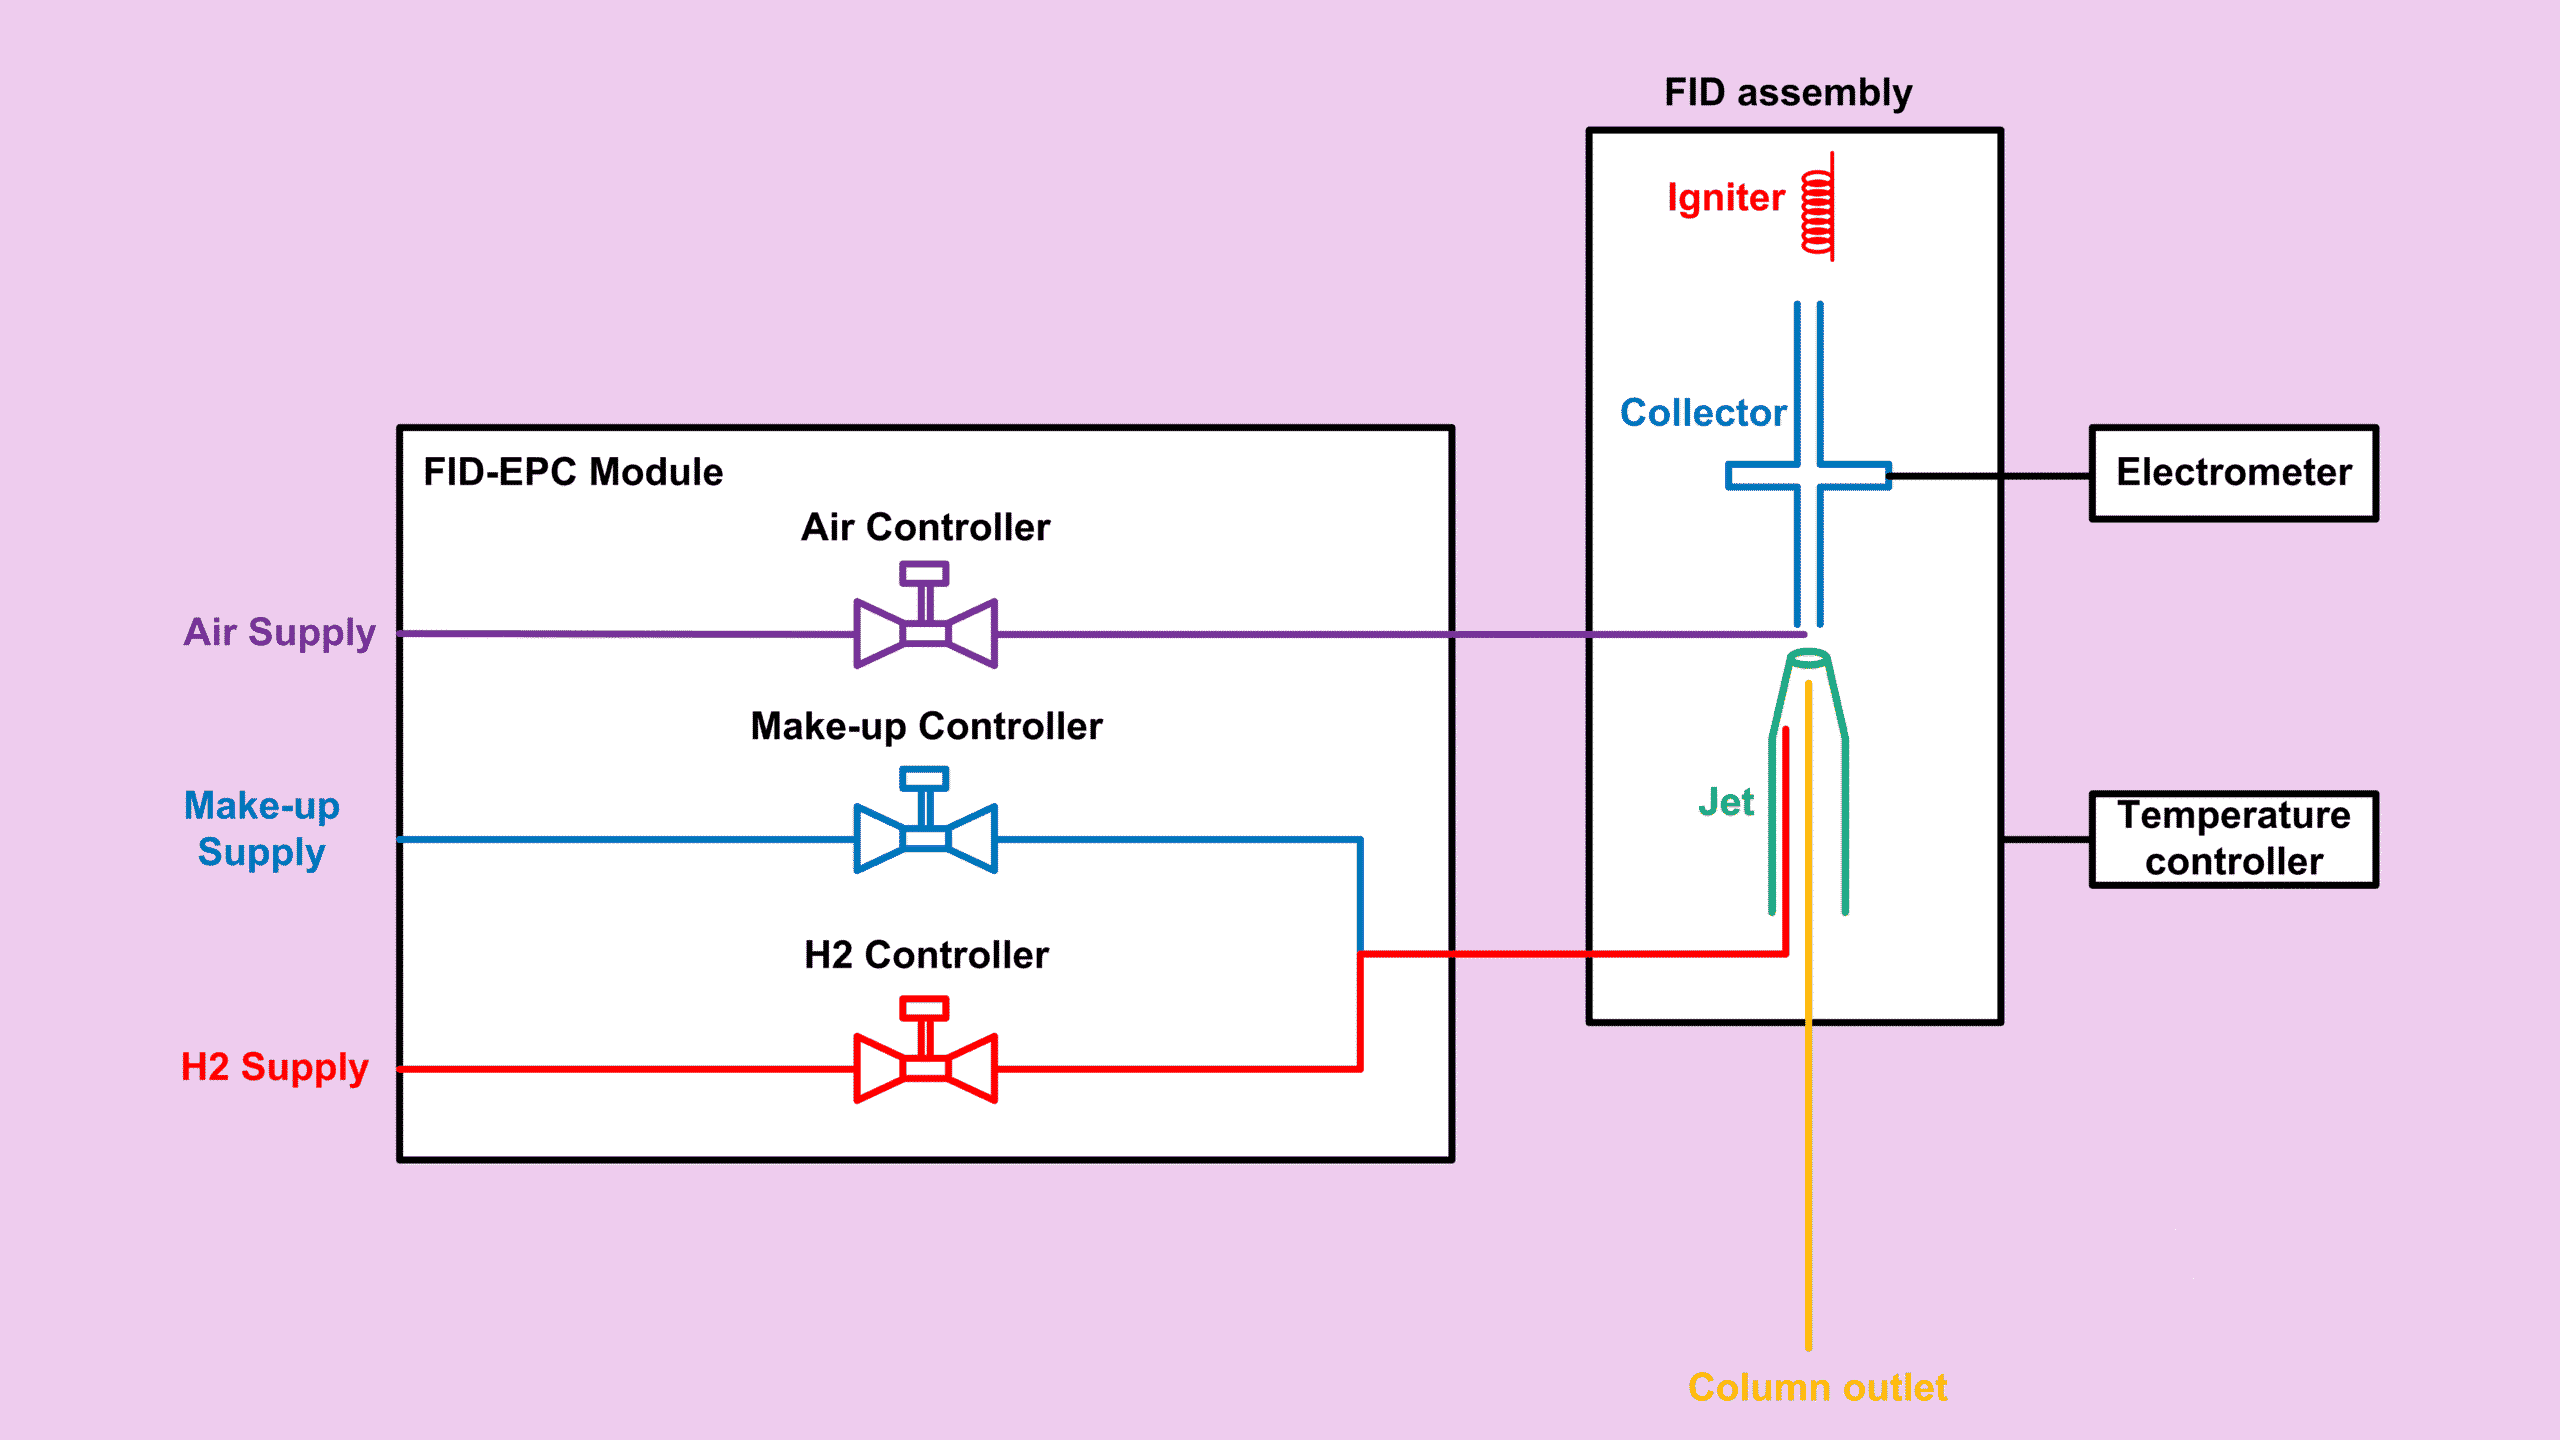
Before we dive in, just to let you know that this article is part of my Flame Ionization Detector (FID) series which you can find the summary for all other posts related to FID at FID Detector: Complete Guide to the Entire FID Series.
Why FID RRF Normalization Works
Let’s start with a common scenario.
A hydrocarbon sample is analyzed on a GC equipped with FID. Because the sample contains only hydrocarbons, the total hydrocarbon concentration adds up to 100%. However, in some cases, the sample may also contain components such as water, which FID does not detect.
In that case, suppose another instrument measures water at 1%. Therefore, total hydrocarbons become 99%, and that value becomes the chosen total normalization basis.
So first, we define:
- Total normalization = 100% (or 99% depending on samples)
- Basis = mole%, mass%, or volume%
Once that decision is made, we can apply FID RRF Normalization.
The Challenge: Too Many Peaks to Calibrate
Even if each peak separates beautifully, many samples contain 100+ peaks. Preparing a calibration mixture for all of them would be extremely time-consuming and often impossible.
So naturally, the question becomes:
Can we quantify all peaks without calibrating them individually?
Yes, and that is exactly what FID RRF Normalization does.
How FID RRF Normalization Works (Simplified Example)
To make the concept easy, let’s reduce the sample to just three compounds:
- Benzene
- Toluene
- Ethylbenzene
Their peak areas (for demonstration only) are:
| Name | Area |
|---|---|
| Benzene | 200 |
| Toluene | 300 |
| Ethylbenzene | 400 |
Now, using the FID Relative Response Factor Calculator for Liquid, take Benzene as the reference compound. For demonstration purpose, only RRF by mass will be used. However, all three bases (mole, mass and volume) can be used if your situation calls for it.
| Name | Area | RRF (Mass) |
|---|---|---|
| Benzene | 200 | 1.000 |
| Toluene | 300 | 1.011 |
| Ethylbenzene | 400 | 1.019 |

Step-by-Step FID RRF Normalization Calculation
Since total normalization equals 100%, mass% of Benzene becomes:
\[ {Mass\%}_{Benzene} = \frac{\text{Amount}_{Benzene}} {\text{Amount}_{Benzene} + \text{Amount}_{Toluene} + \text{Amount}_{Ethylbenzene}} \times 100 \]Now recall:
\[ \text{Amount}_i = RF_i \times Area_i \]And since:
\[ RRF_i = \frac{RF_i}{RF_{ref}} \]We can rewrite:
\[ RF_i = RF_{ref} \times RRF_i \]Therefore:
\[ \text{Amount}_i = RF_{ref} \times RRF_i \times Area_i \]Here is the key point:
Because every term contains RFref, it cancels out in the final ratio.
That’s why it doesn’t matter which compound you choose as reference.
After simplification:
\[ Mass\%_i = \frac{Amount_i}{\sum_{i=1}^{n} Amount_i} = \frac{RRF_i \times Area_i} {\sum_{i=1}^{n} (RRF_i \times Area_i)} \times 100 \]And this final formula can be used for a mixture of not just three compounds as in this example, but many more compounds such as those in ASTM D6730 with a few hundreds.
Final Calculated Results Using FID RRF Normalization
For Benzene:
\[ Mass\%_{Benzene} = \frac{1 \times 200} {1 \times 200 + 1.011 \times 300 + 1.019 \times 400} \times 100 = 21.96\% \]For Toluene:
\[ Mass\%_{Toluene} = \frac{1.011 \times 300} {1 \times 200 + 1.011 \times 300 + 1.019 \times 400} \times 100 = 33.30\% \]For Ethylbenzene:
\[ Mass\%_{Ethylbenzene} = \frac{1.019 \times 400} {1 \times 200 + 1.011 \times 300 + 1.019 \times 400} \times 100 = 44.75\% \]That’s the power of this approach: no calibration standards required.
Use the FID RRF Normalization Calculator
To make this even easier, I built an interactive FID RRF Normalization calculator.
You simply enter:
- Peak areas
- Corresponding RRF values
The calculator instantly determines each compound’s contribution (up to six compounds).
Additionally, since verification is often necessary, the calculator also allows comparison against real calibration results.

Key Takeaway
Knowing RRF, the normalization allows you to:
- Quantify large numbers of peaks
- Avoid preparing massive calibration mixtures
- Maintain compliance with normalization-based ASTM methods
- Simplify routine hydrocarbon analysis
Most importantly, it transforms a complex chromatogram into actionable quantitative data.
Explore More Posts
If this helped clarify how FID RRF Normalization works, explore the other related posts below.