
In this post, we will talk about GC peak skewness. It describes whether a peak is skewing to the left side or the right side, and more importantly, how symmetric the peak really is.
What Is GC Peak Skewness?
Peak skewness is used to evaluate how symmetric a chromatographic peak is. In practice, you may come across different ways to calculate peak skewness. For example, some methods use:
- \[
\frac{Left Segment}{Right Segment}
\] - \[
\frac{Right Segment}{Left Segment}
\] - \[
\frac{2 \times {Left Segment}}{Left Segment + Right Segment}
\]
Regardless of the formula, the idea behind peak skewness stays the same.
How Symmetry Relates to GC Peak Skewness
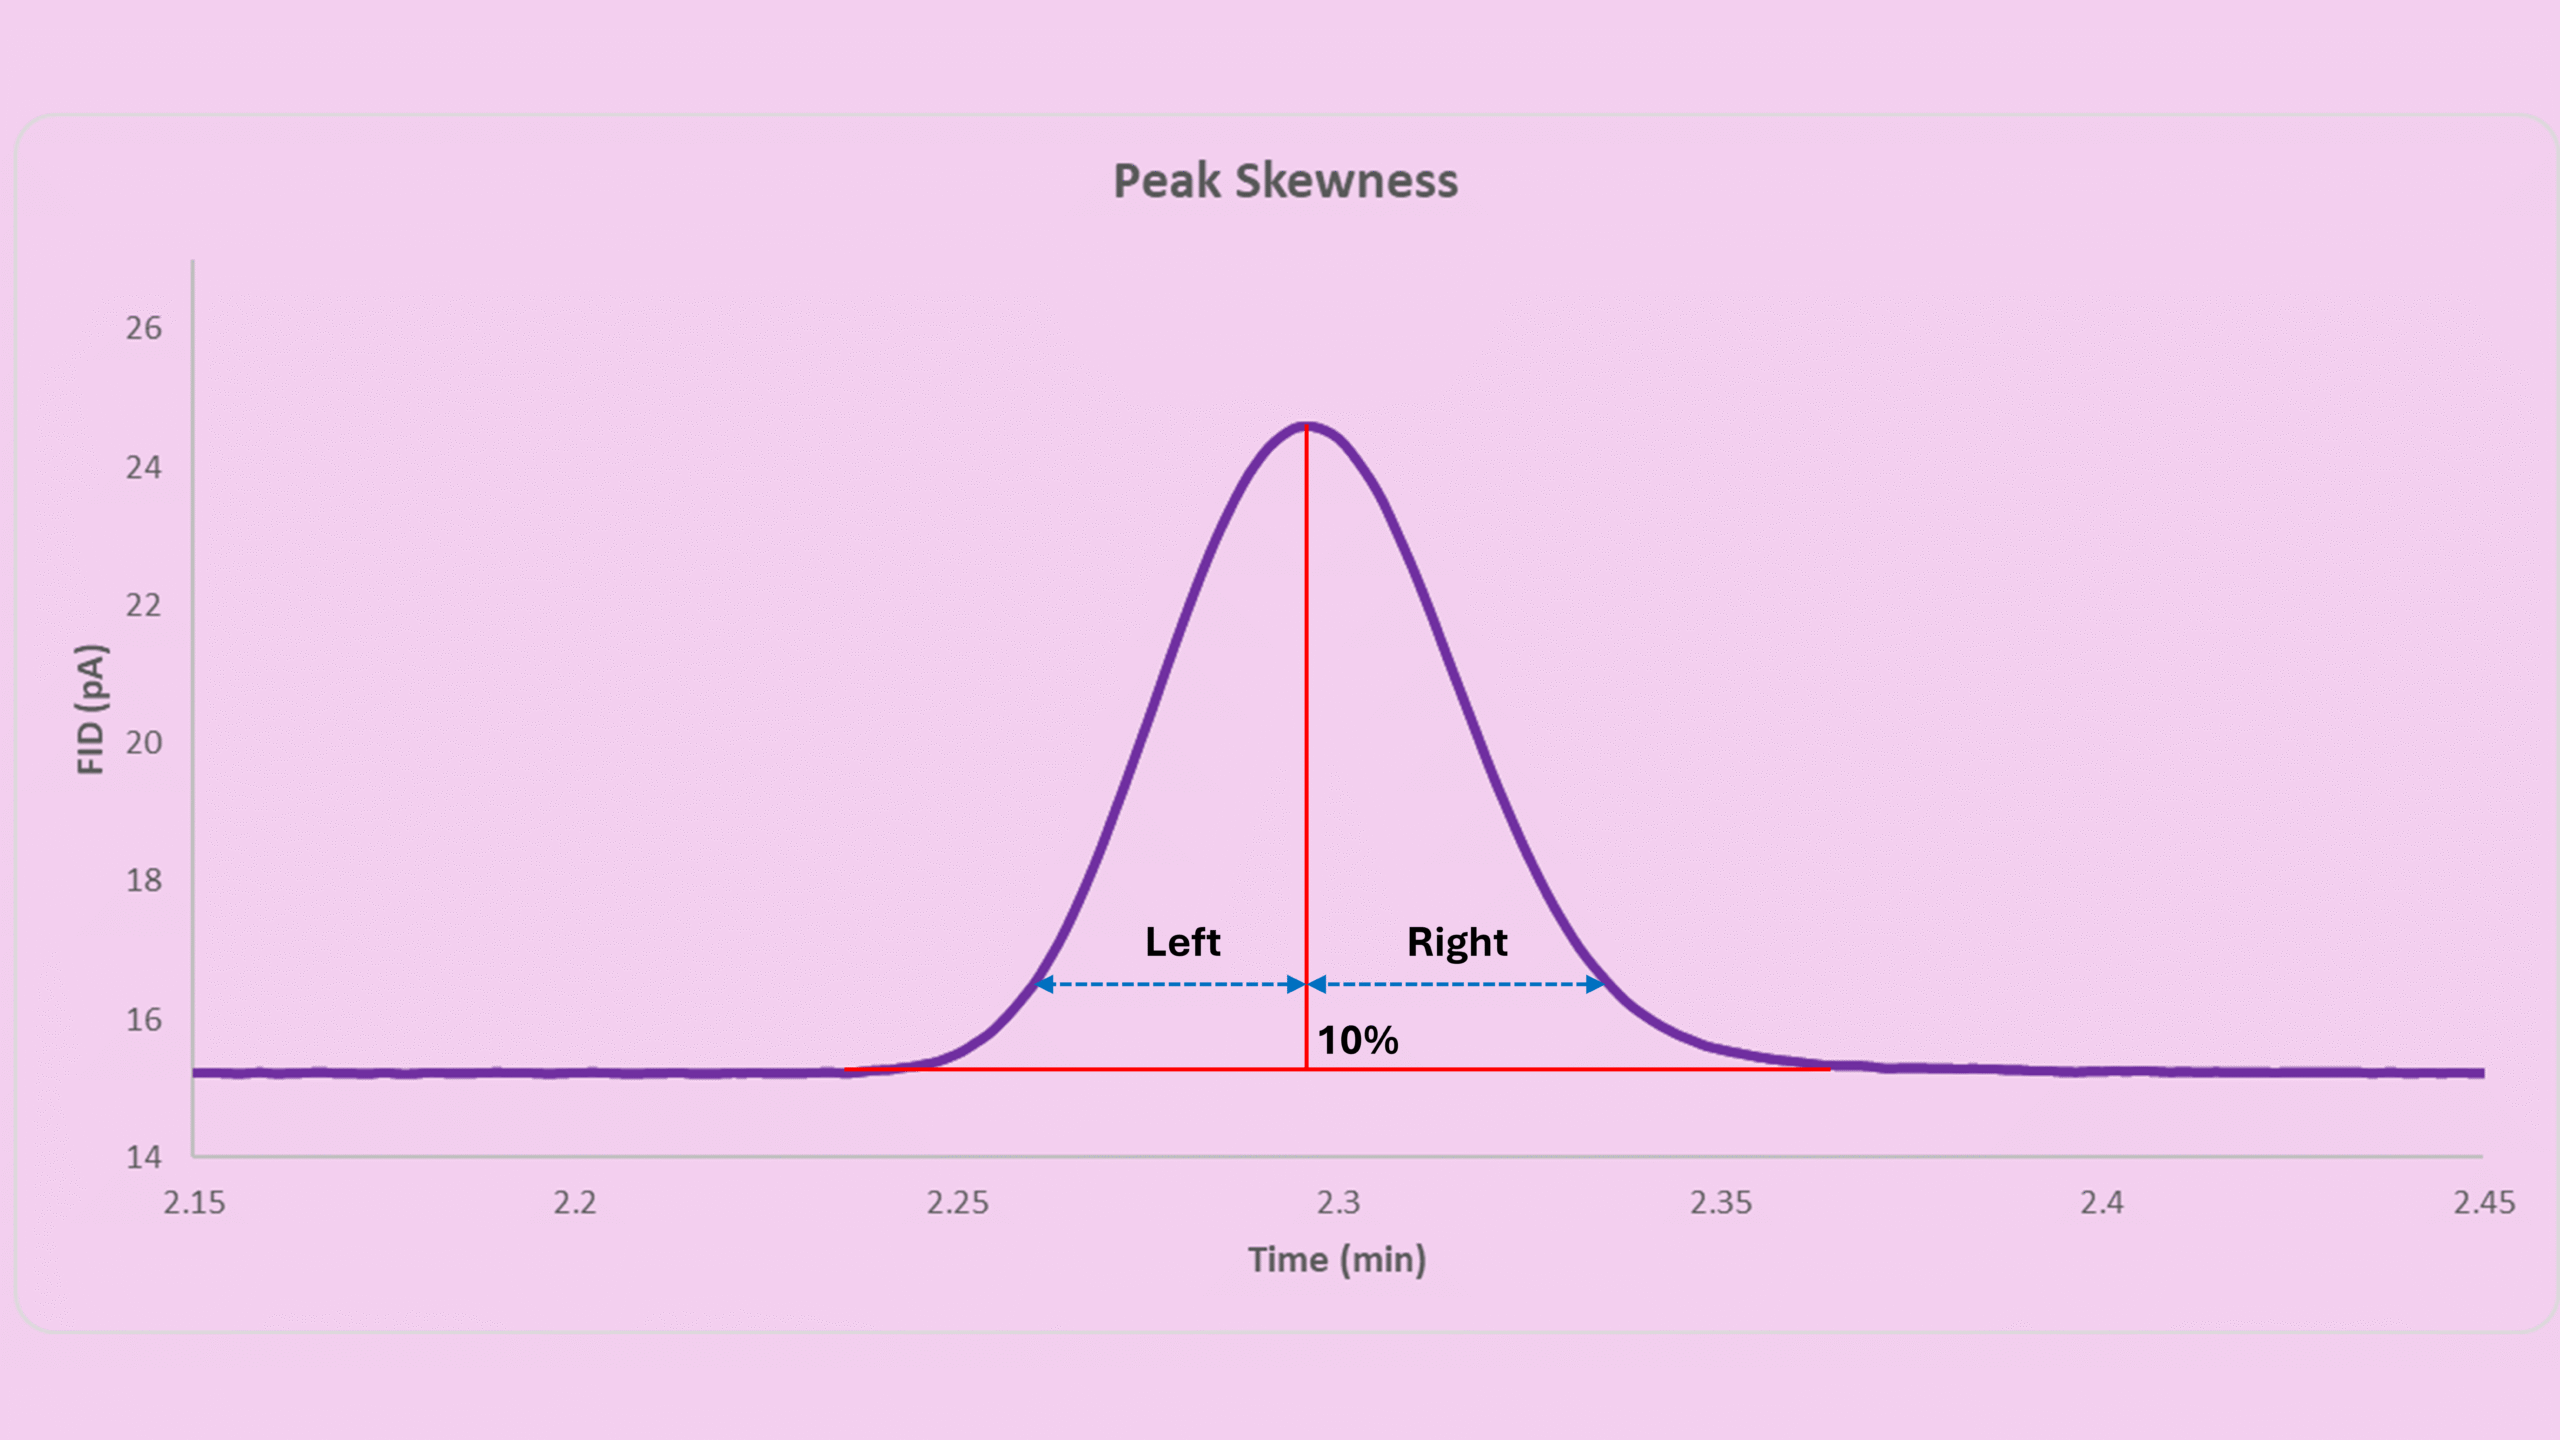
The “left” and “right” refer to the segments illustrated in the peak diagram.
Some methods define these segments at:
- 5% of peak height
- 10% of peak height
- 50% of peak height
However, a perfectly symmetric peak will always have:
\[
Left = Right
\]
Therefore, the peak skewness value becomes:
\[Skewness=1
\]
So, the closer the value is to 1, the better the symmetry. As a rule of thumb, peak skewness should typically fall between 0.7 and 1.3.
GC Peak Skewness vs Tailing Factor
Sometimes, peak skewness is also referred to as tailing factor. Although the terms are often used interchangeably, they may follow slightly different calculation methods depending on the software or standard used.
How to Calculate GC Peak Skewness Manually
Most chromatography software can calculate peak skewness automatically for selected peaks. However, if needed, you can still do it manually:
- Draw a baseline of the peak
- From the top of the peak, draw a vertical line to the baseline
- If peak skewness is calculated at 10%, draw a horizontal line at 10% of the peak height to both sides
- The distance from the left side of the peak to the vertical line is the left segment, while the other side is the right segment
- Calculate peak skewness using your preferred formula
For convenience, I’ve also made a calculator available on my site (Peak Skewness Calculator). You just need to enter the left and right segments, select your preferred formula, and the peak skewness will be calculated instantly.
Key Takeaways
- GC peak skewness tells you how symmetric your peak is
- A value close to 1 indicates a well-shaped peak
- Acceptable range is typically 0.7 to 1.3
- Different formulas exist, but the concept remains the same
- You can calculate it manually or use software/calculators
Ready to Improve Your GC Data?
Understanding peak skewness is a small step that makes a big difference in data quality. Try the calculator on my site and see how your peaks perform.
Check out other posts about column evaluation below:
- GC Column Characteristics
- Average Linear Gas Velocity in GC: What It Means and How to Use It
- GC Peak Resolution Calculation: What It Really Means in Practice
- Number of Theoretical Plates Explained in Gas Chromatography
- GC Retention Factor Calculation (k) – Simple and Practical Guide
- GC Retention Index Explained Simply
- Retention Index Calculation Made Simple for GC Users