
In this post, we will dive into gc peak resolution calculation, a key factor used to evaluate separation performance. It’s often tied to column performance, but in my opinion, it should be called method performance instead. Although the column is the heart of gas chromatography, separation can improve significantly with the right oven temperature program, pressure control, or even a combination of columns. Therefore, saying resolution evaluates only the column can be misleading.
What Is GC Peak Resolution Calculation?
Peak resolution is a figure that shows how well two adjacent peaks are separated.
The formula is as below:
\[ R_s = \frac{2 \times {(t_{R2} – t_{R1})}} {1.699 \times {(w_{1/2,1} + w_{1/2,2})}} \]Where:
- tR1 and tR2: retention times (min)
- w1/2,1 and w1/2,2: peak widths at half height (min)
For the top of the formula:
The further apart the two peaks → the larger the RT difference → the higher the resolution.
For the bottom of the formula:
The broader the peaks → the greater the overlap → the lower the resolution.
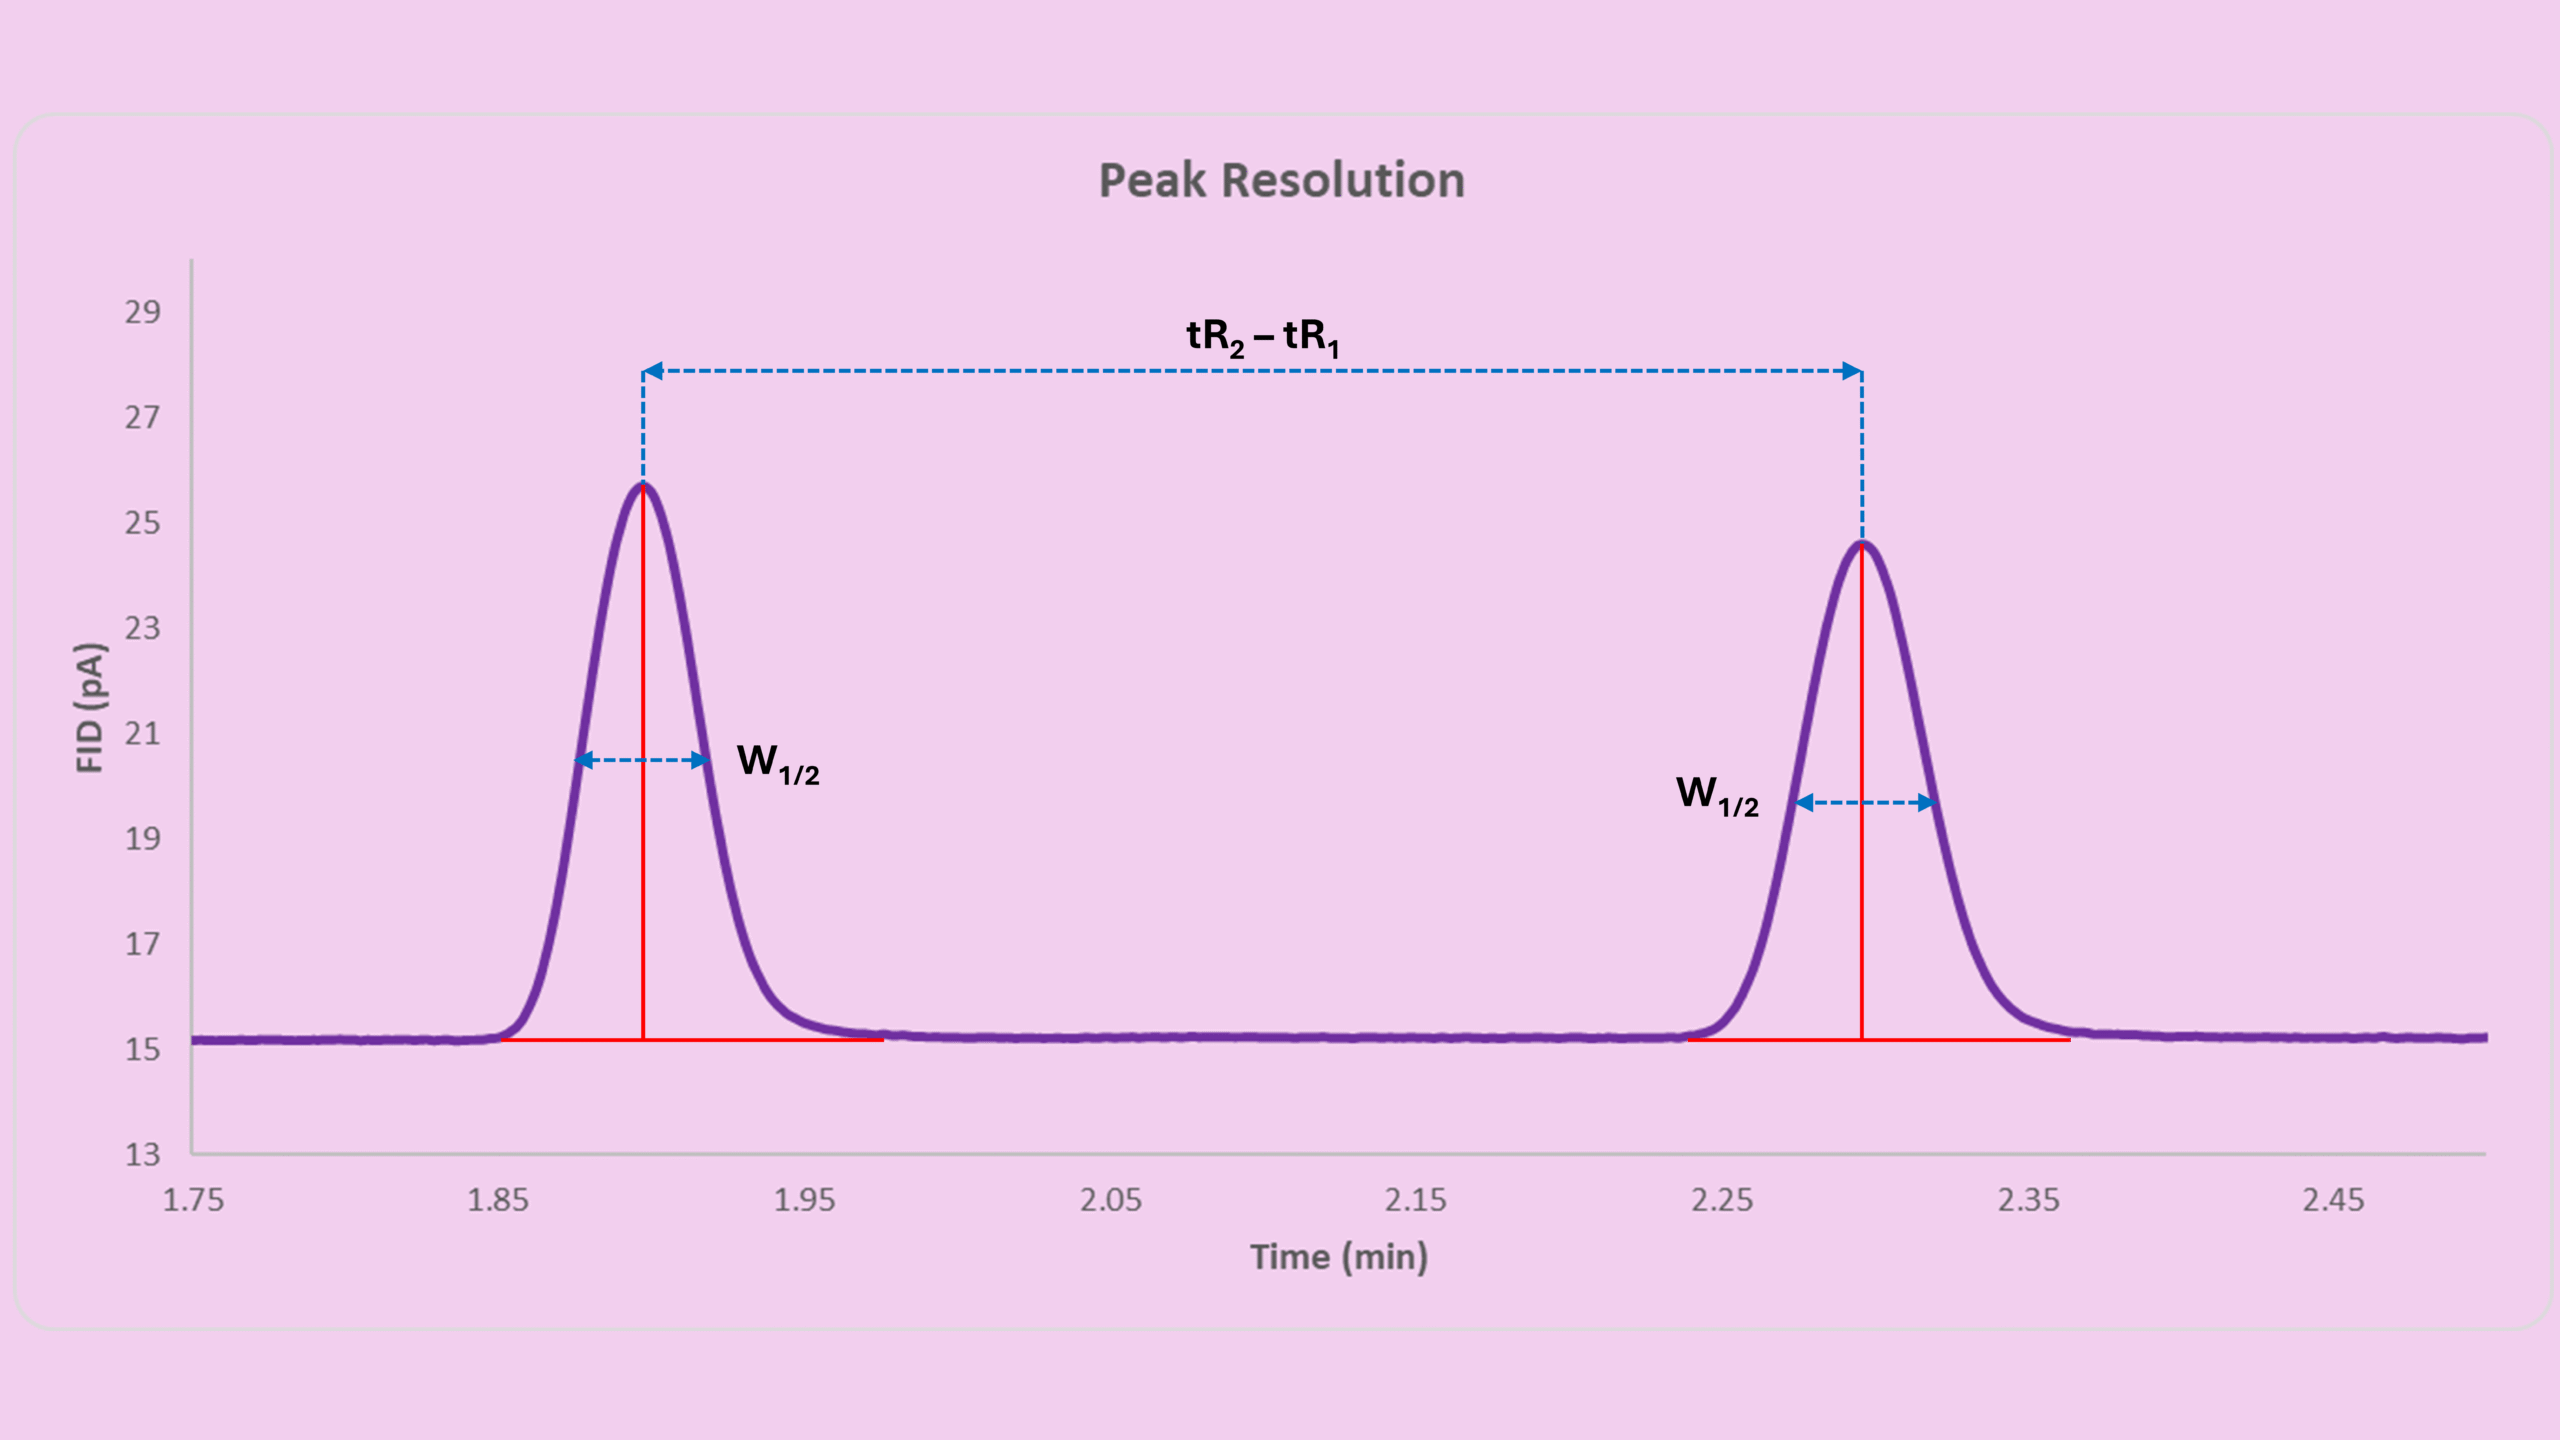
Understanding GC Peak Resolution Calculation Visually
In summary, the further apart and sharper the peaks, the better the peak resolution result.
However, there is a common misconception about achieving the “best resolution.” Instead of endlessly improving resolution for just two peaks, you should focus on whether the resolution is good enough for the entire method. After all, a method must work for all analytes, not just a selected pair.
If improving one pair worsens others, then it is no longer an improvement.
Typically, a resolution of 1.5–2.0 is considered the minimum acceptable range.
GC Peak Resolution Calculation Using Baseline Width
Are you curious where the formulas come from, especially the 1.699 magic number?
Let’s start with a simpler version of peak resolution calculation using baseline width:
\[ R_s = \frac{2 \times {(t_{R2} – t_{R1})}} {w_1 + w_2} \]As mentioned in my earlier post, Understanding Gaussian Distribution Chromatography in Practical GC Work, the half-height width is: w1/2=2.354σ
And the baseline width is typically: wb=4σ
This uses only about 95% of the peak instead of 6σ or 8σ. That’s because real peaks are not perfectly Gaussian, and going further into the tails introduces too much noise.
Where Does the 1.699 Factor Come From?
Now we compare the two:
\[ \frac{w_b}{w_{1/2}}=\frac{4\sigma}{2.354\sigma}=1.699 \]That means the baseline width is 1.699 times the half-height width.
Replacing this into the earlier formula:
\[ R_s = \frac{2 \times {(t_{R2} – t_{R1})}} {w_1 + w_2} \] \[ R_s = \frac{2 \times {(t_{R2} – t_{R1})}} {1.699 \times w_{1/2,1} + 1.699 \times w_{1/2,2}} \] \[ R_s = \frac{2 \times {(t_{R2} – t_{R1})}} {1.699 \times {(w_{1/2,1} + w_{1/2,2})}} \]This is how the commonly used form of gc peak resolution calculation is derived.
When Should You Use Each Method?
Unless your method or protocol specifies otherwise:
- Use baseline width if peaks are not symmetric
- Use half-height width if peaks are symmetric
Most modern software can handle gc peak resolution calculation automatically. At minimum, it will provide retention time and peak width at half height.
You can then:
- Plug values into the formula
- Or use the calculator on my site
👉 Chromatography Resolution Calculator (Rs from Two Peaks)
How to Do GC Peak Resolution Calculation Manually
If needed, you can perform gc peak resolution calculation manually:
- Draw a baseline for both peaks
- From each peak top, draw a vertical line to the baseline
- Measure peak height, divide by 2, and draw a horizontal line
- Measure the width at that half-height line
- Read the retention times at peak tops
- Enter the values into your calculator
Key Takeaway
- GC peak resolution calculation reflects method performance, not just column performance
- Both peak spacing and peak sharpness matter
- The 1.699 factor comes from converting baseline width to half-height width
- Choose the method based on peak symmetry
- Focus on sufficient resolution, not maximum resolution
Final Thought
Understanding gc peak resolution calculation helps you make better decisions when optimizing your method. Instead of chasing perfect separation, aim for a balanced method that works reliably across all analytes.
If you want to simplify your workflow, try using the resolution calculator on the site and compare results instantly.
Check out other posts about column evaluation below:
- GC Column Characteristics
- Average Linear Gas Velocity in GC: What It Means and How to Use It
- GC Peak Skewness Explained Simply
- Number of Theoretical Plates Explained in Gas Chromatography
- GC Retention Factor Calculation (k) – Simple and Practical Guide
- GC Retention Index Explained Simply
- Retention Index Calculation Made Simple for GC Users