
We’ve covered the FID series extensively, and now it’s time to shift gears into columns. In this new series, we’ll focus on GC column characteristics—what they are, why they matter, and how they directly impact your separation results.
I’m not here to explain how columns are manufactured. Instead, we’ll focus on what actually matters in daily work: understanding column specifications, evaluating performance, and making practical decisions in the lab.
Understanding GC Column Characteristics
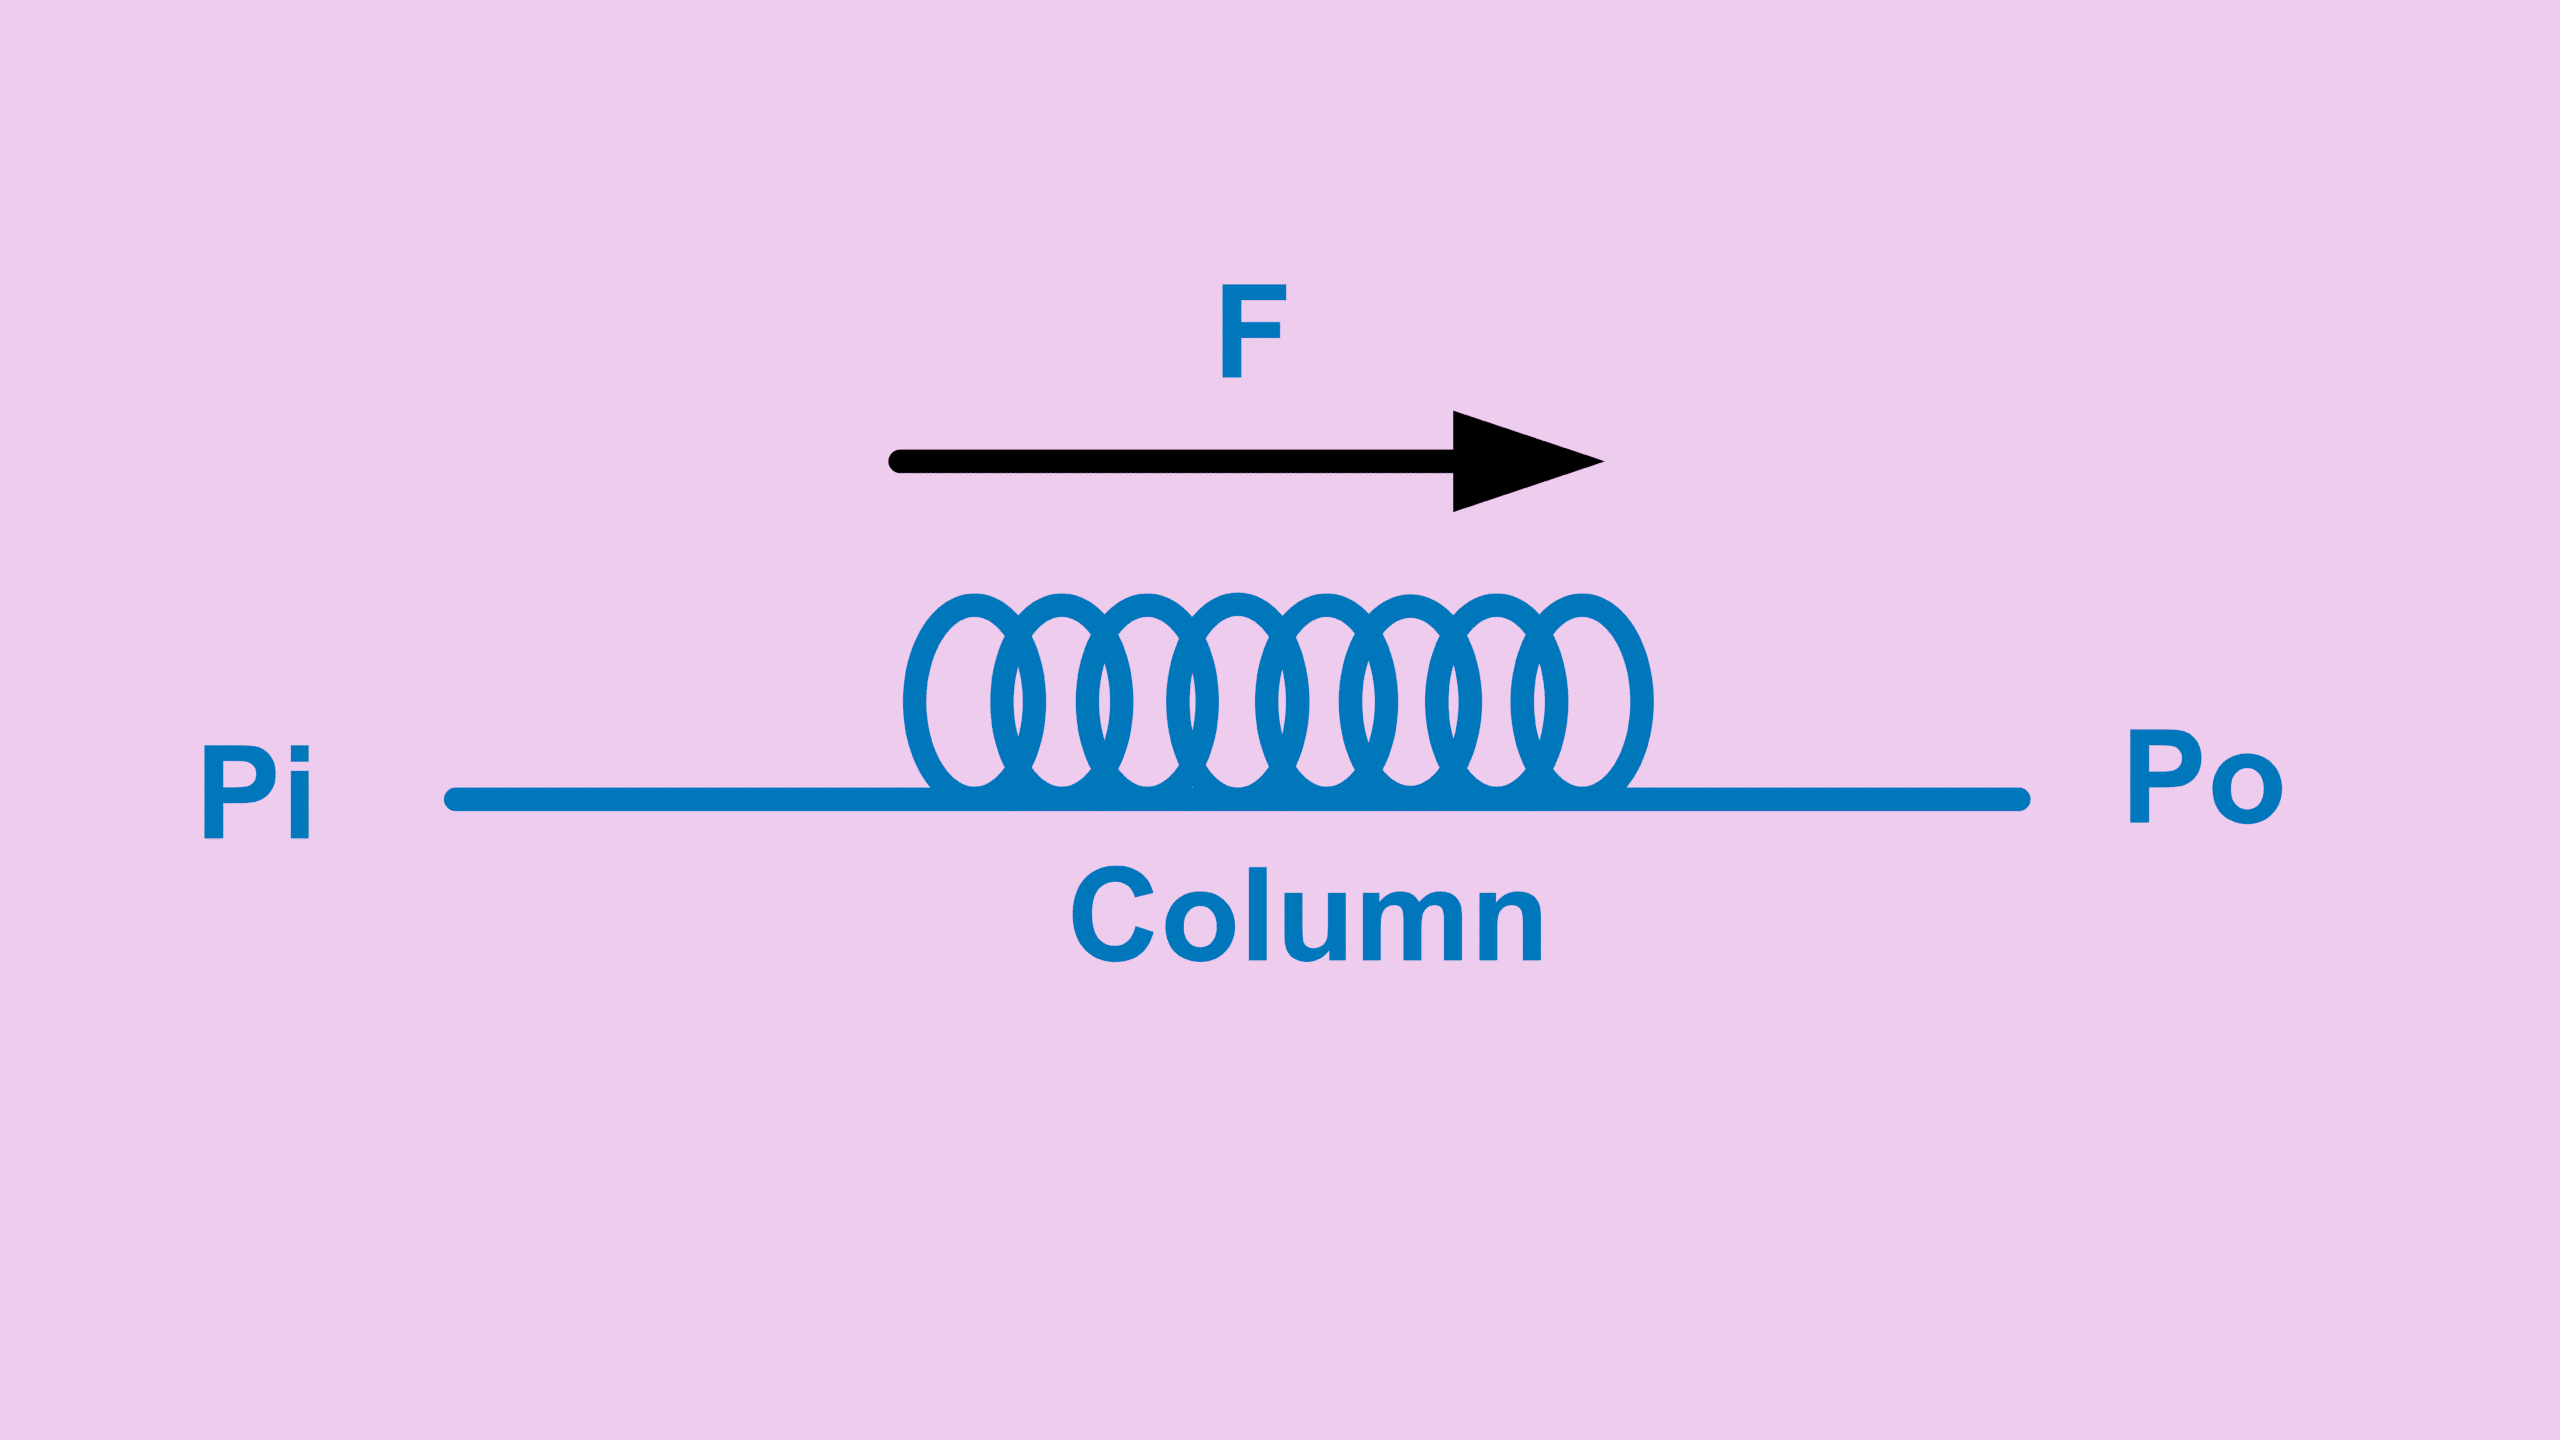
Columns are the core of any GC system. Without the right column, separation simply won’t happen—no matter how good your detector or method is.
Choosing the wrong column leads to wasted time and cost. However, even with the right column, poor usage makes the results just as meaningless. So, understanding GC column characteristics is critical.
Also, keep in mind: one column may not be enough. In many cases, multiple columns must be combined to achieve full separation. Therefore, stay flexible in your approach.
Stationary Phase in GC Column Characteristics
The stationary phase is the material coated inside the column that interacts with analytes. Simply put, it controls how compounds separate.
A simple rule applies here:
“Like father, like son.”
- Non-polar analytes → use non-polar stationary phase
- Polar analytes → use polar stationary phase
Because of this, selecting the correct stationary phase is one of the most important GC column characteristics to consider.
Column Temperature Range
Another key part of GC column characteristics is the operating temperature range.
Most columns list something like -60 °C to a maximum temperature. In practice, the minimum temperature is rarely used.
However, the maximum temperature is critical.
- Never heat a column without carrier gas flow
- Operate at least 20 °C below the max temperature
- If needed, limit operation at max temperature to less than 20 minutes
These simple rules help prevent column damage and extend lifespan.
Column Dimensions and Their Impact
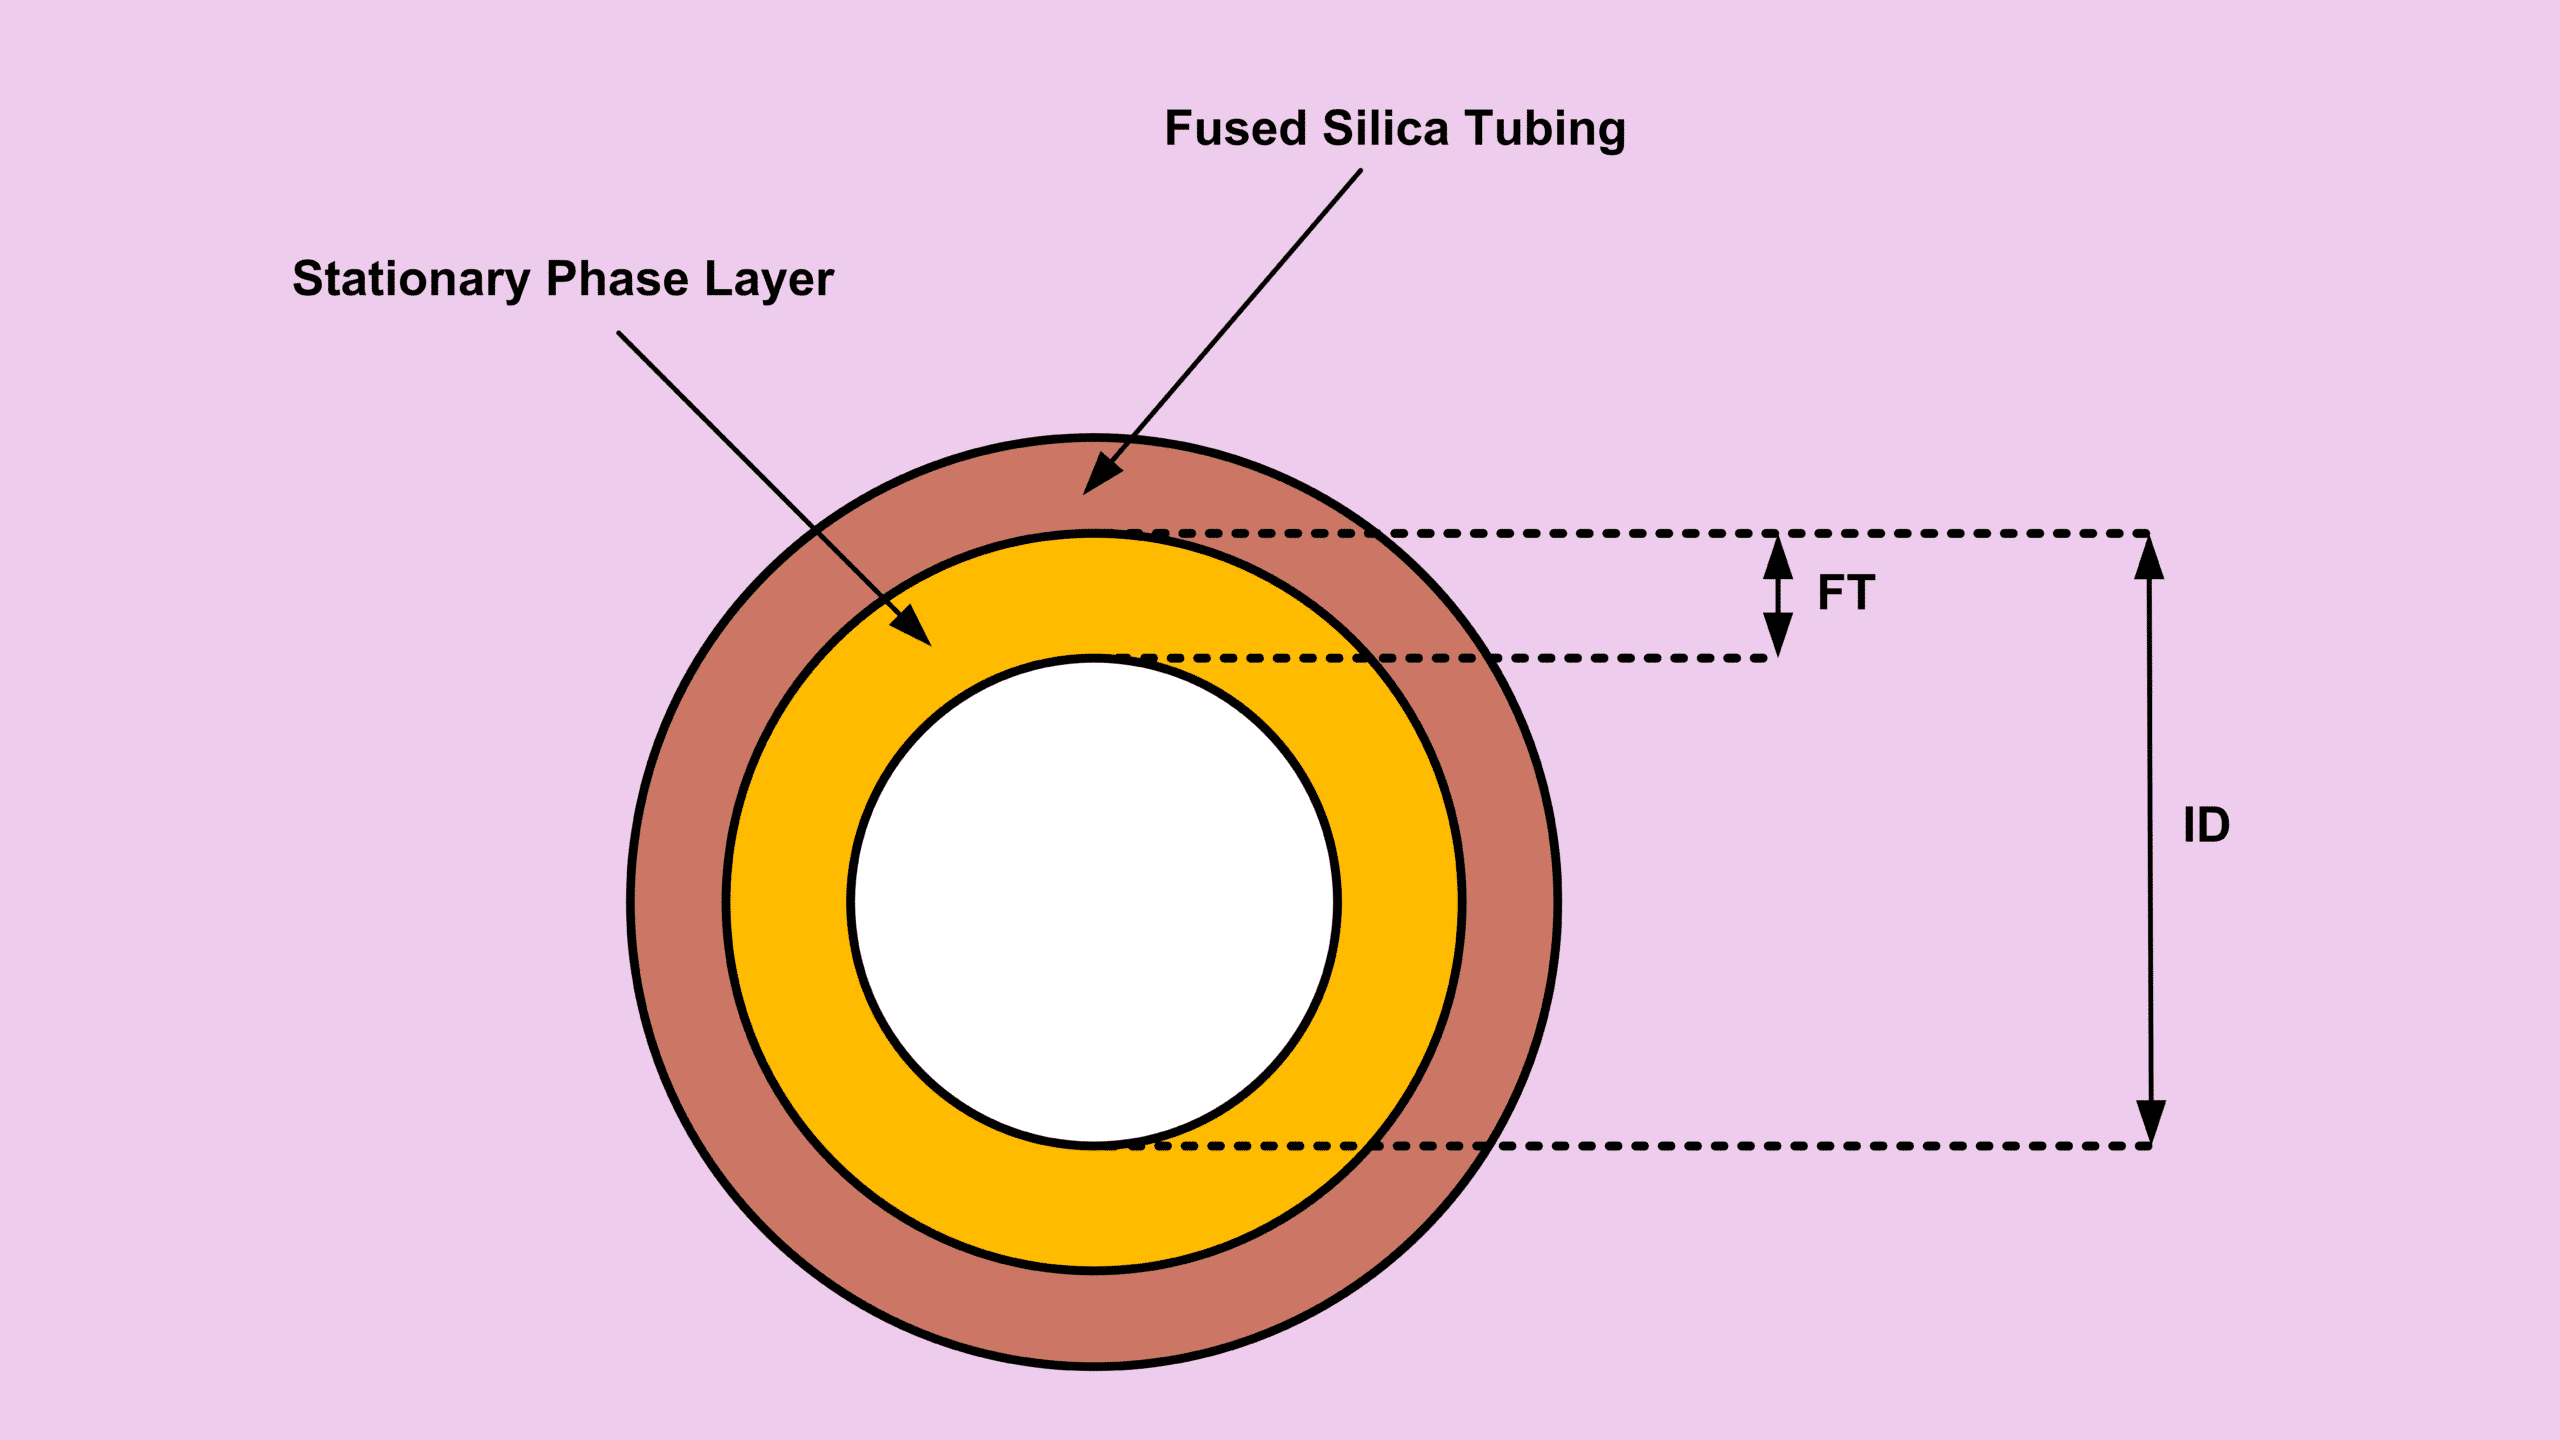
Column dimensions are typically written as:
Length × Internal Diameter × Film Thickness
Example: 15 m × 0.53 mm × 0.15 µm
Each parameter plays a role in GC column characteristics and performance.
Column Length
- Pro: Longer columns improve separation
- Con: Require higher pressure
Think of it like a marathon—the longer the distance, the easier it is to separate runners.
Column Internal Diameter (ID)
- Pro: Smaller ID improves separation due to more interaction
- Cons:
- Higher pressure required
- Lower sample capacity
Additionally, smaller ID columns are easier to coil.
Film Thickness (FT)
- Pro: Thicker film increases interaction and improves separation
- Cons:
- More column bleed
- Lower maximum temperature
Compared to ID, FT has less effect on pressure but still influences performance.
Test Data and Performance Check
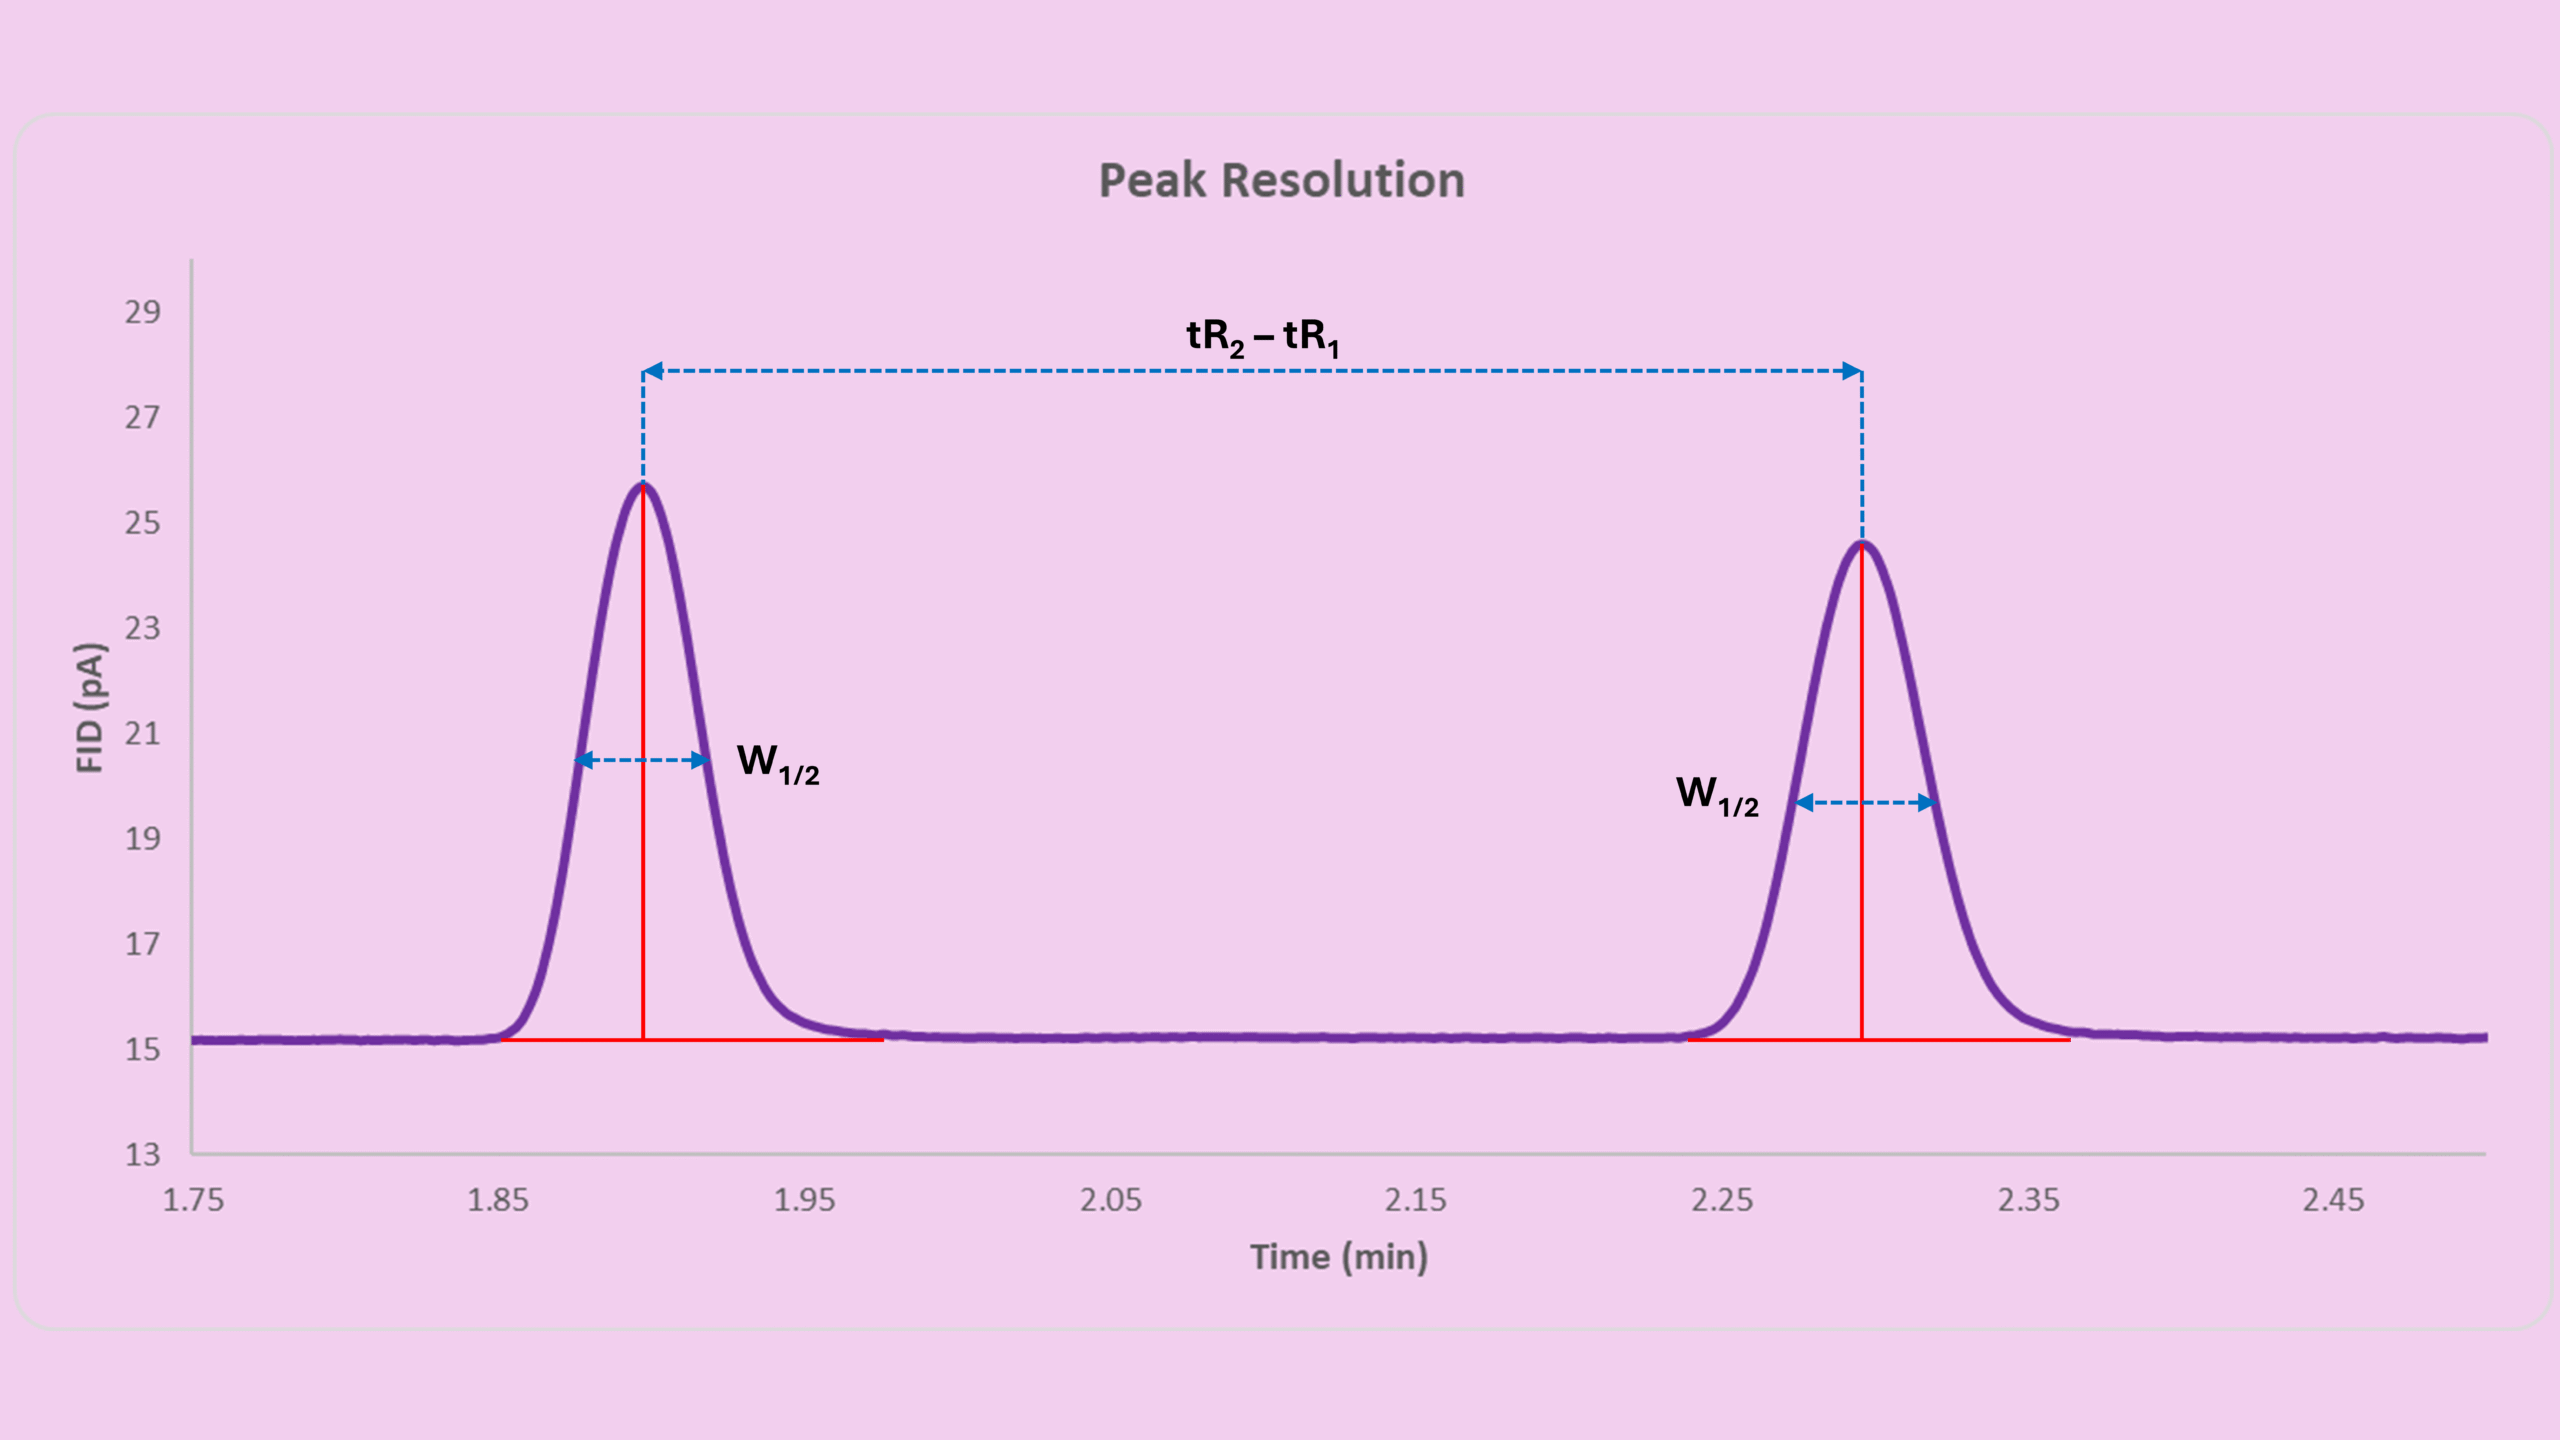
Manufacturers usually provide test chromatograms along with operating conditions.
However, these are not always directly relevant to your application. So instead of focusing on the exact method, look for:
- Maximum temperature used in the test
- Baseline stability (column bleed)
- Peak symmetry
These factors give a better indication of real GC column characteristics.
For method-specific columns like:
- Restek Rtx-DHA-100
- Agilent Lowox Column
You should compare test data against method criteria such as:
Packed Column Characteristics
Packed columns share many GC column characteristics with capillary columns, except one key difference:
there is no film thickness.
Instead, they use particle packing with mesh size.
For example:
- 60/80 mesh
- 80/100 mesh
What does this mean?
- Higher mesh → smaller particles
- Smaller particles → higher surface area
- Higher surface area → better separation
However:
- Smaller particles → higher pressure
- Stronger interaction → higher contamination risk
Interaction Mechanisms in Columns
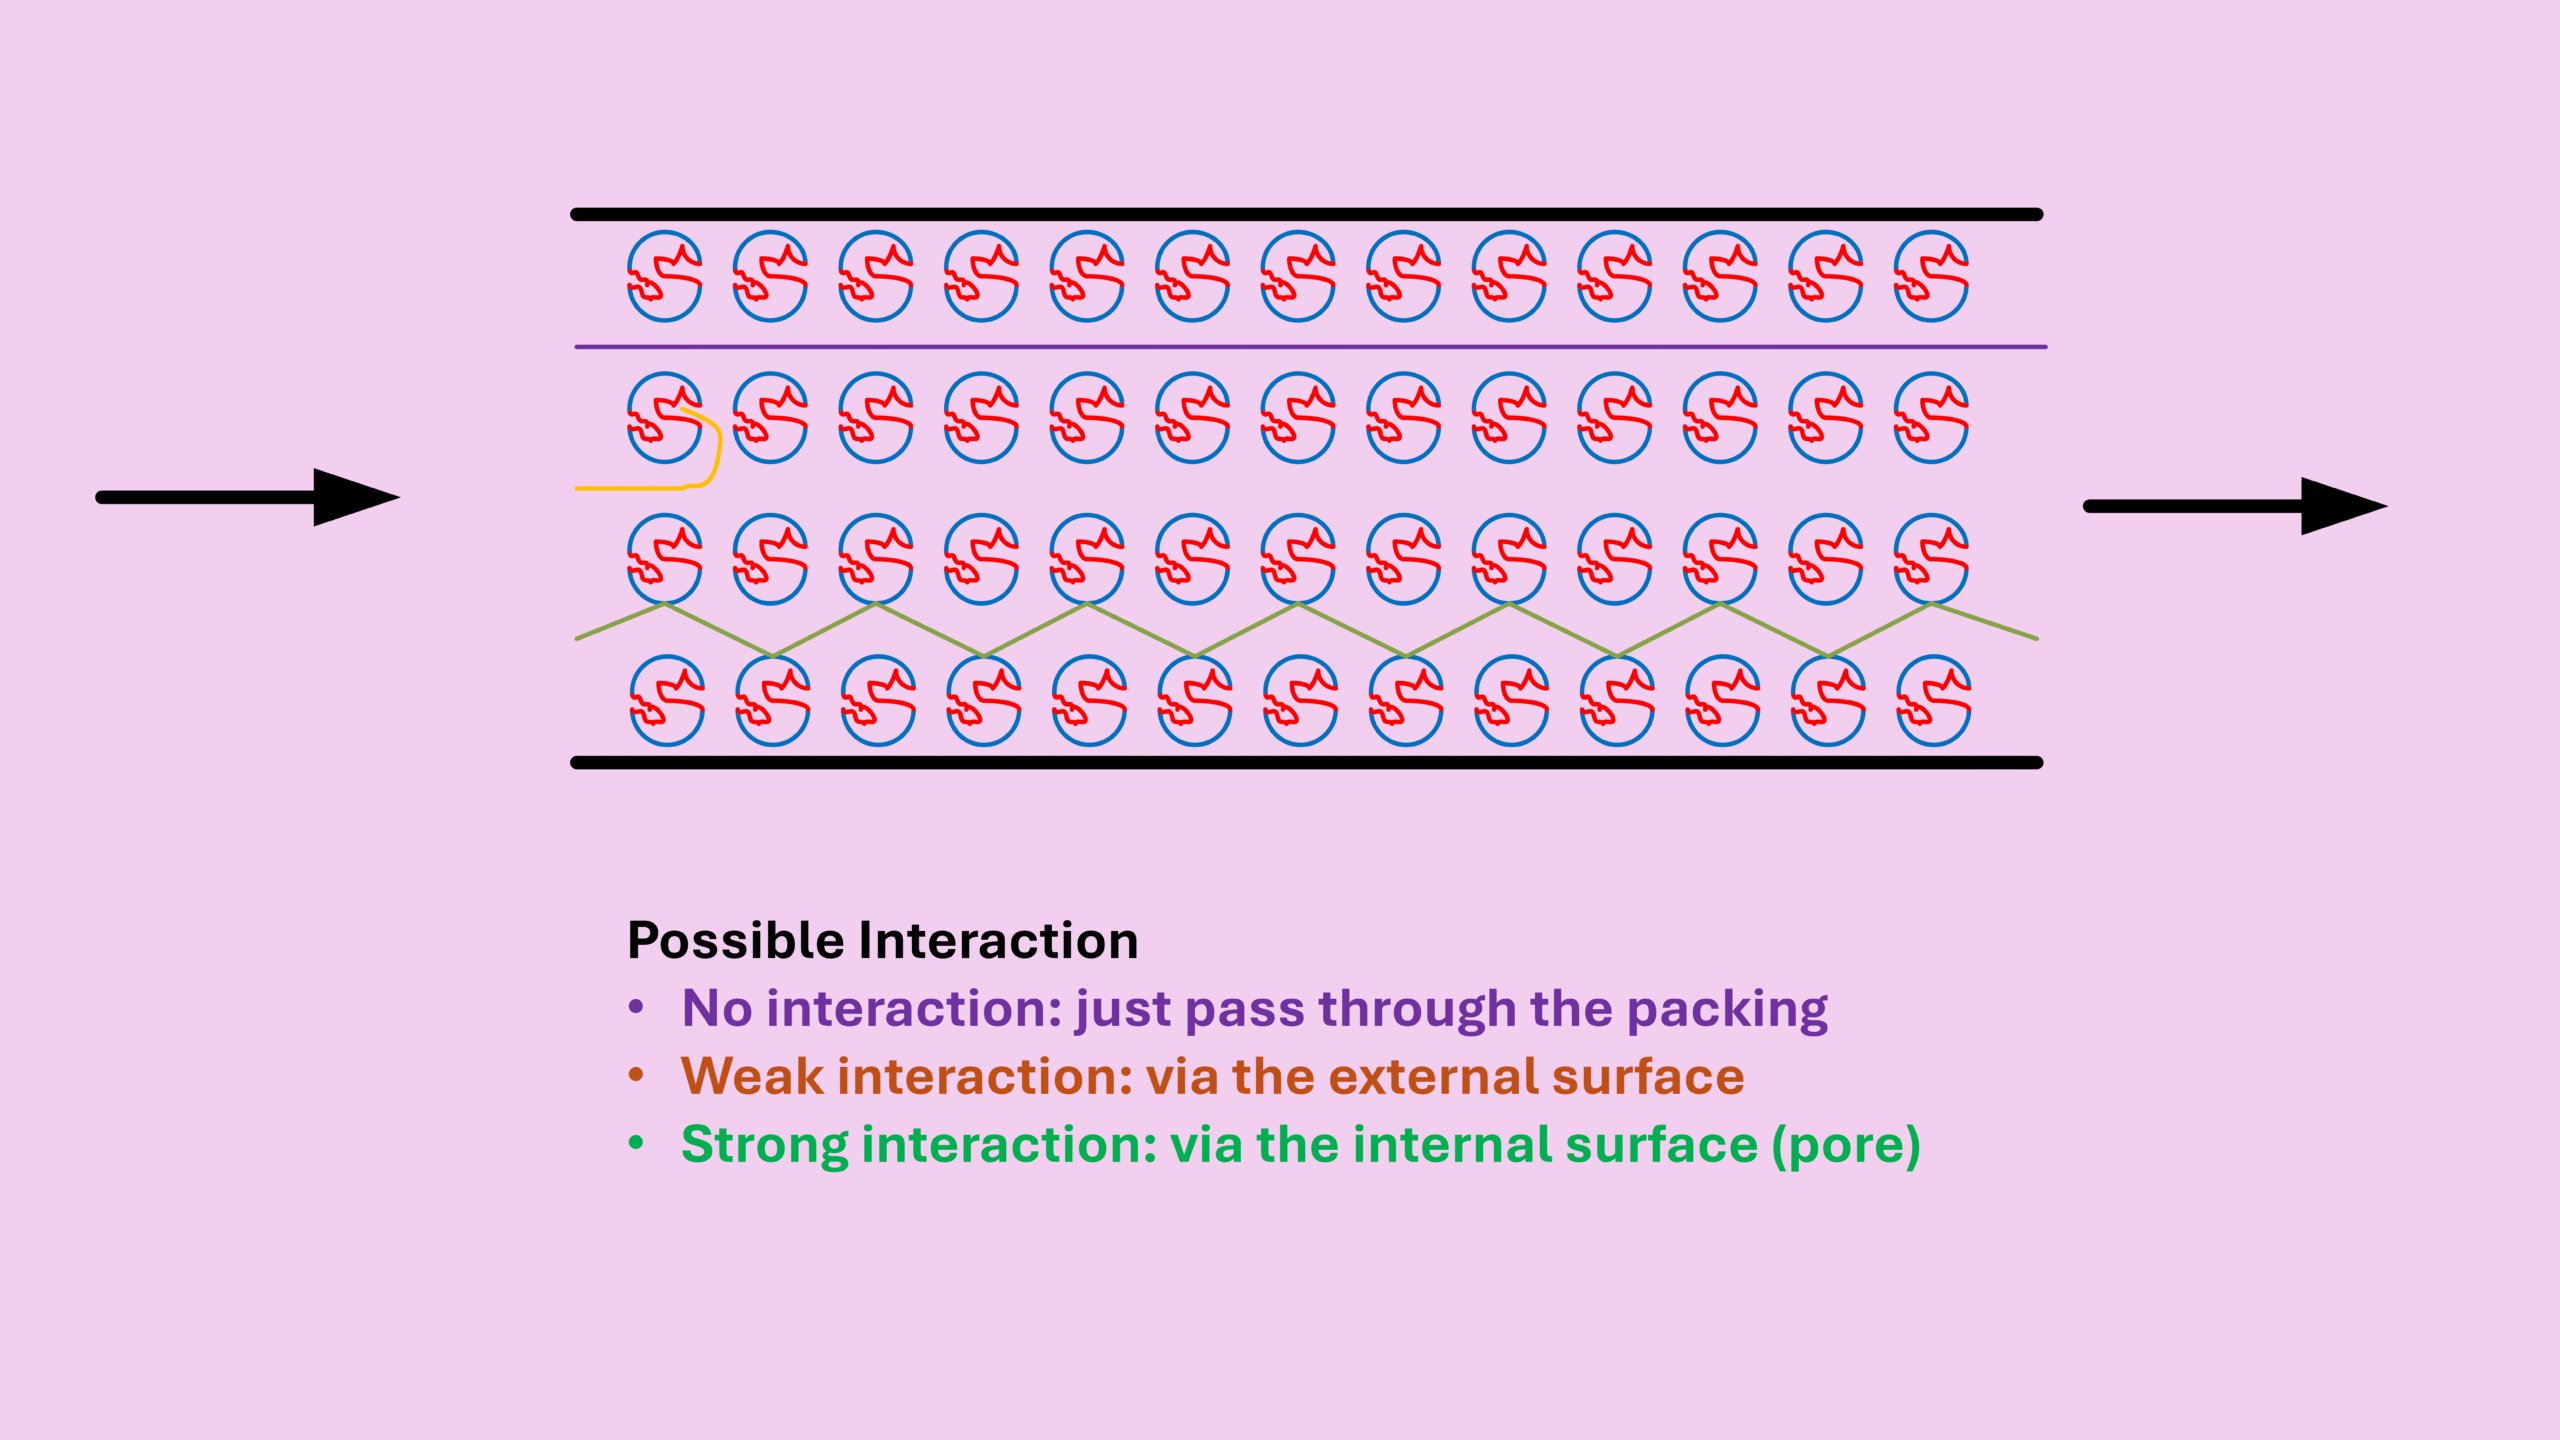
Understanding analyte interaction is essential when evaluating GC column characteristics.
There are four main scenarios:
- No interaction → analytes pass straight through
- Weak interaction → limited surface interaction
- Strong interaction → analytes enter pores and interact deeply
- Extremely strong interaction → analytes get trapped and require very high temperature to elute
Key Takeaways
- GC column characteristics directly determine separation quality
- Stationary phase selection is the most critical factor
- Temperature limits must always be respected
- Column dimensions affect pressure, separation, and capacity
- Test data should be evaluated based on performance, not method similarity
- Packed columns introduce mesh size as a key parameter
Continue Learning
If you’re working with GC regularly, understanding GC column characteristics will save you time, cost, and frustration.
Check out other posts about column evaluation below:
- Average Linear Gas Velocity in GC: What It Means and How to Use It
- GC Peak Resolution Calculation: What It Really Means in Practice
- GC Peak Skewness Explained Simply
- Number of Theoretical Plates Explained in Gas Chromatography
- GC Retention Factor Calculation (k) – Simple and Practical Guide
- GC Retention Index Explained Simply
- Retention Index Calculation Made Simple for GC Users